
Figure 2. Psychophysical Results.
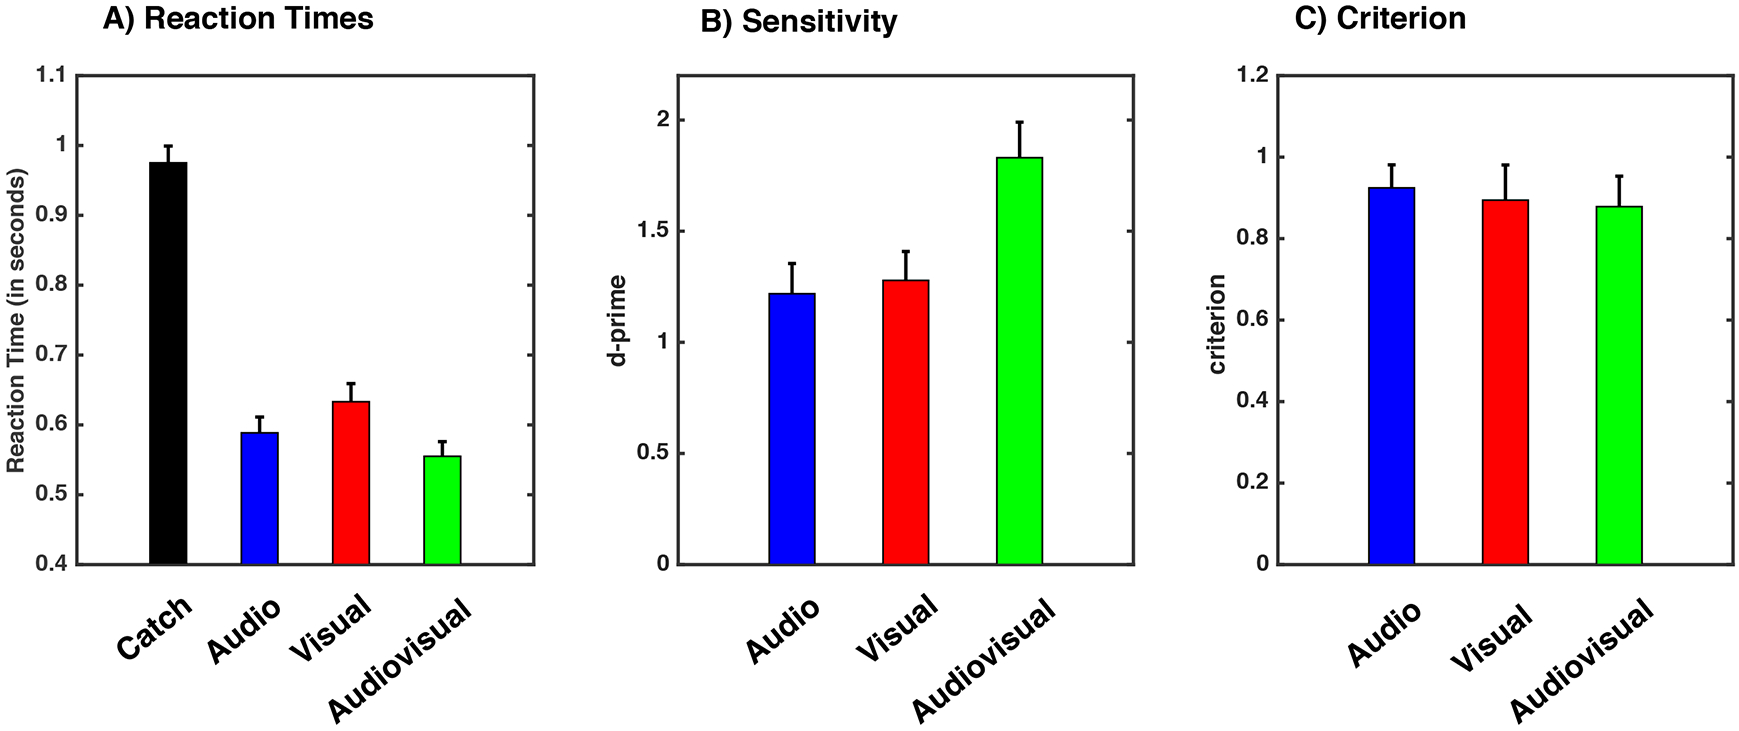
A) Mean reaction times per sensory modality condition in response to perceived stimuli. Please note y-axis does not commence at 0 ms, but 400 ms. B) Sensitivity (i.e., d’) and C) criterion for audio (blue), visual (red) and audiovisual (green) conditions. Error bars indicate +1 S.E.M. across participants.