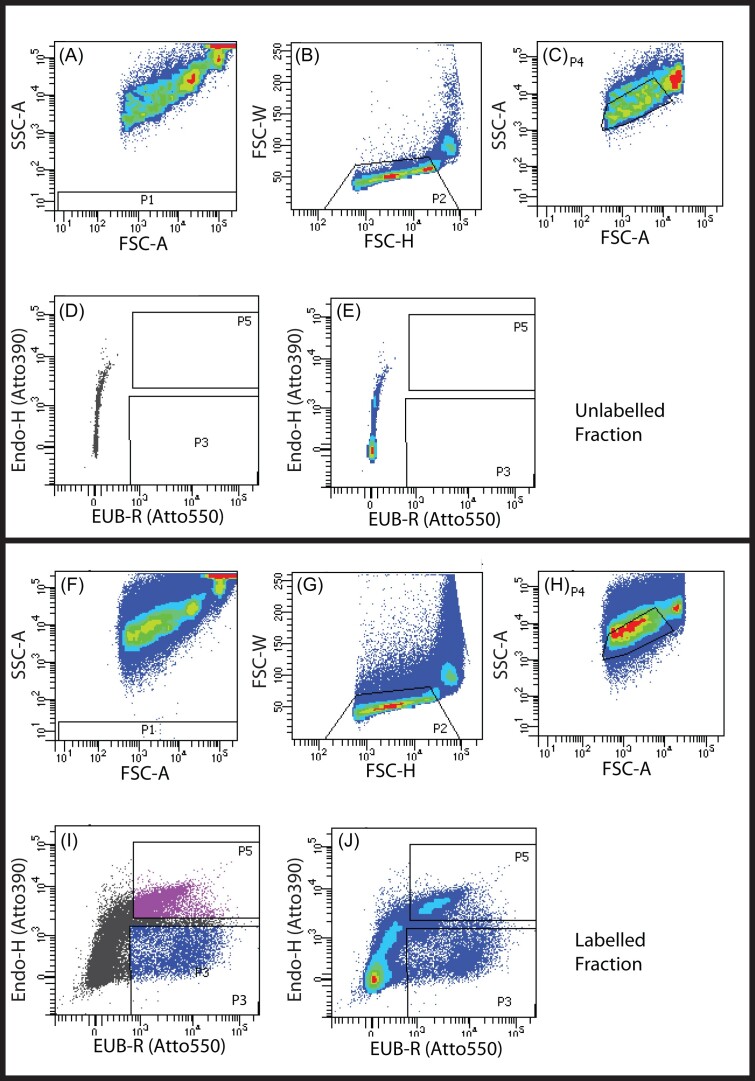
Figure 2.
FACS sorting profiles for unlabelled (A-E) and labelled (F-J) A. loripes tissue homogenate (genotype Al08). First, background noise (P1) from the FACS was excluded (A, F). Large coral and Symbiodiniaceae cells were then identified by forward (B, G) and side (C, H) scatter and excluded through sequential gating. Fluorescent channels were used to identify autofluorescence of the remaining events in the unlabelled fraction in the 582 nm (D-E x-axis) and 450 nm (D-E y-axis) emissions. Events in the labelled fraction that surpassed this baseline autofluorescence in both axes were collected as the dual labelled ‘Endozoicomonas’ population (P5) and those that had greater signal on the x-axis only were collected as the single labelled ‘all-bacteria’ population (P3) (I-J).

