
Fig. 1.
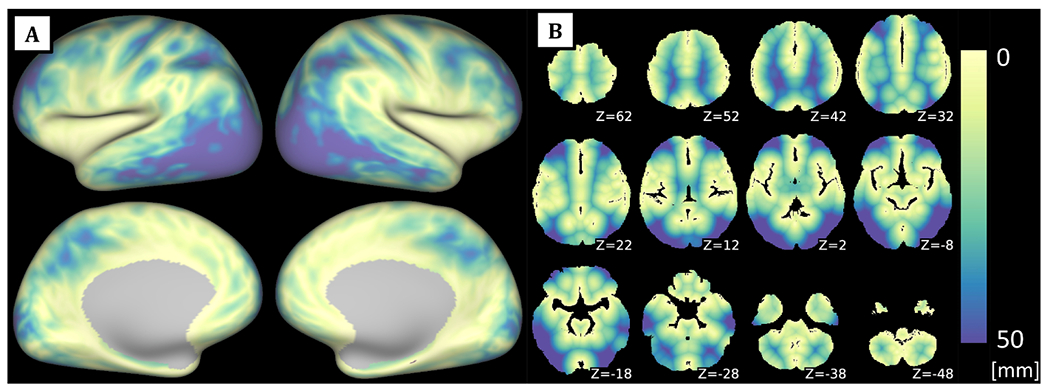
Atlas of Euclidean distances to the nearest artery reconstructed on the surface (A) and in Montreal Neurological Institute (MNI) 3D space (B) based on the Statistical Atlas of Cerebral Arteries. White colour denotes areas relatively closer to the nearest artery, blue colour relatively more distant (see the colour scale at the right). Z values denote the level in z-axis (in mm) in the MNI space.