
FIGURE 3.
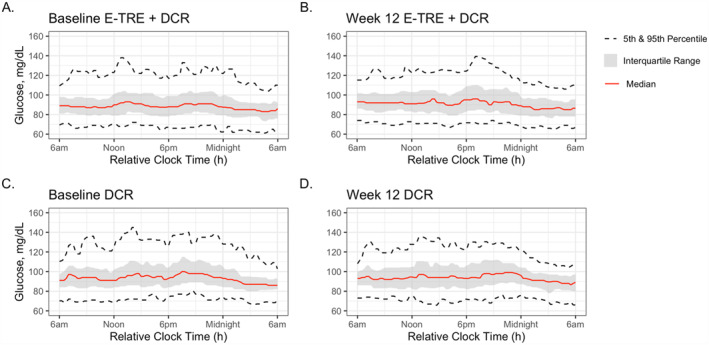
Continuous glucose tracings. Continuous glucose tracings of the E‐TRE+DCR and DCR groups at Baseline and after the 12‐week intervention.
Official websites use .gov
A
.gov website belongs to an official
government organization in the United States.
Secure .gov websites use HTTPS
A lock (
) or https:// means you've safely
connected to the .gov website. Share sensitive
information only on official, secure websites.
Continuous glucose tracings. Continuous glucose tracings of the E‐TRE+DCR and DCR groups at Baseline and after the 12‐week intervention.