
FIGURE 4.
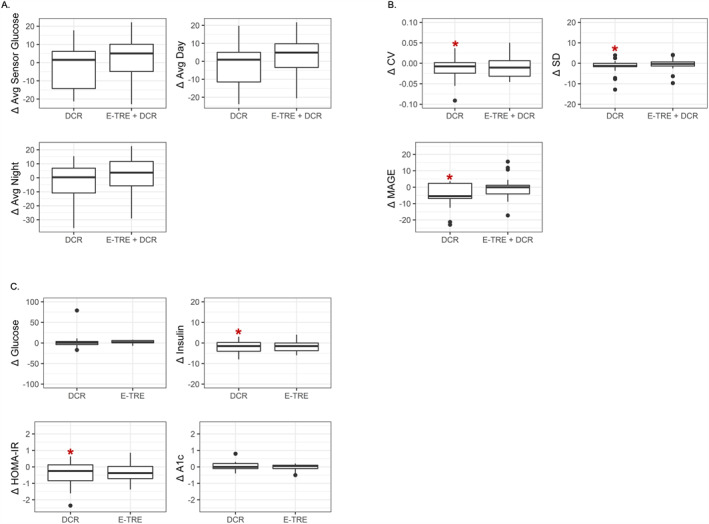
Change in glucose and insulin variables from Baseline to Week 12. Changes are shown for average changes in (A) average overall glucose, average glucose during the day, average glucose during the night, and day/night ratio; (B) coefficient of variation, standard deviation, and mean amplitude of glycemic excursions; and (C) glucose, insulin, homeostatic model assessment of insulin resistance (HOMA‐IR), and A1c. Boxplots show the median, 25th and 75th percentiles (IQR). Whiskers are 1.5× IQR. *Statistically significant change from baseline (p < 0.05 extracted from mixed models adjusting for weight).