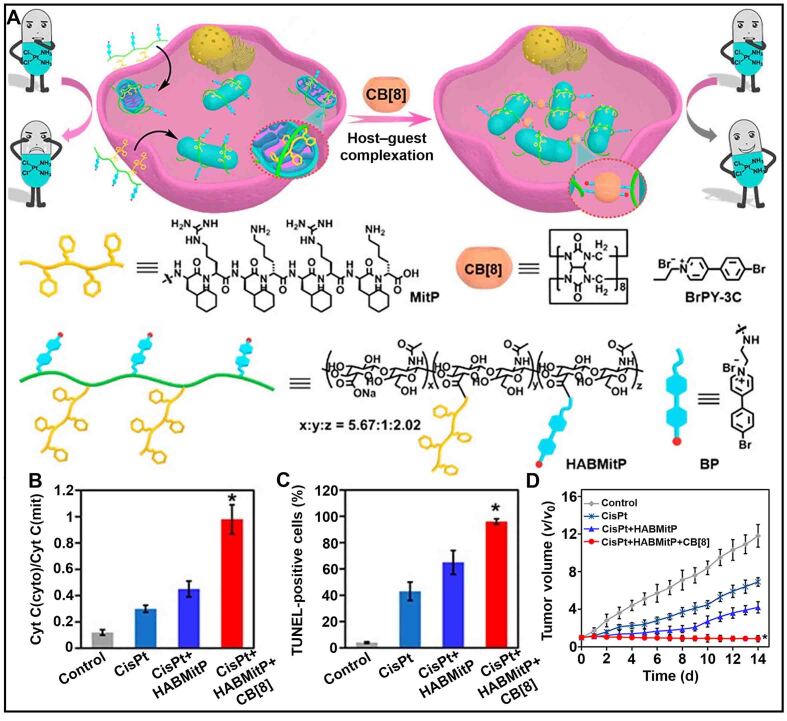
Figure 9.
(A) Schematic illustration of mitochondrial aggregation progress after treatment with multivalent supramolecular polymer (HABMitP) and CB[8]; (B) The ratio of cytosol cytochrome C [Cyt C(cyto)] to mitochondrial cytochrome C [Cyt C(mit)] and (C) The apoptosis percentage of TUNEL-positive cells with different treatments; (D) Changes of tumor volume in tumor-bearing mice with different formulations (*P < 0.05). This figure is quoted with permission from Dai et al.[136].

