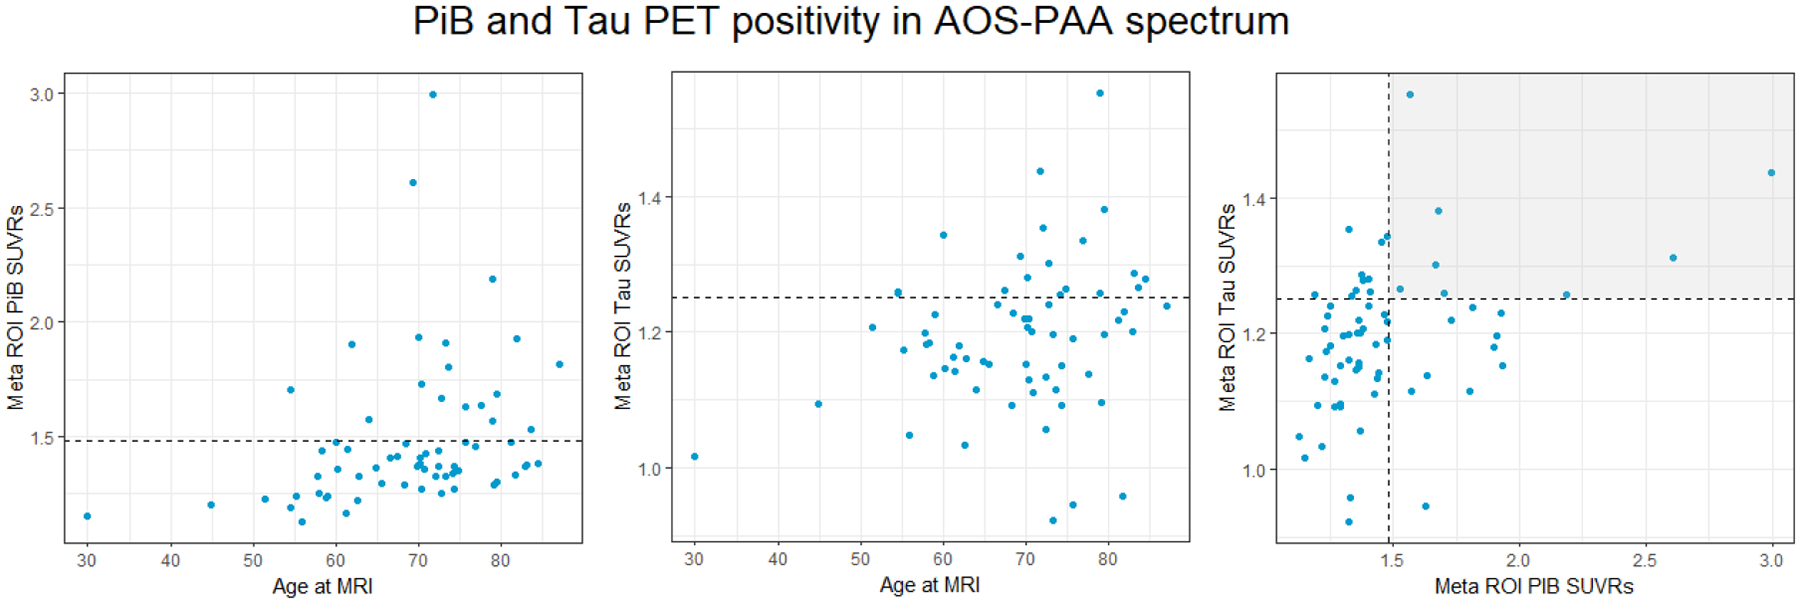
Fig. 1.

Plots of PiB and tau PET by age at imaging, and between PiB and tau SUVRs. The dashed lines show the threshold of what is considered PiB and tau positive for each imaging modality. Each point above the dotted line represents a patient who is positive on that imaging biomarker. In the third graph, each point within the shaded quadrant represents a patient who is positive on both PiB and tau PET biomarkers.
