
Fig. 5. CCR7 is specifically expressed in ALK+ cells in primary ALCL and derepressed by ALK degradation.
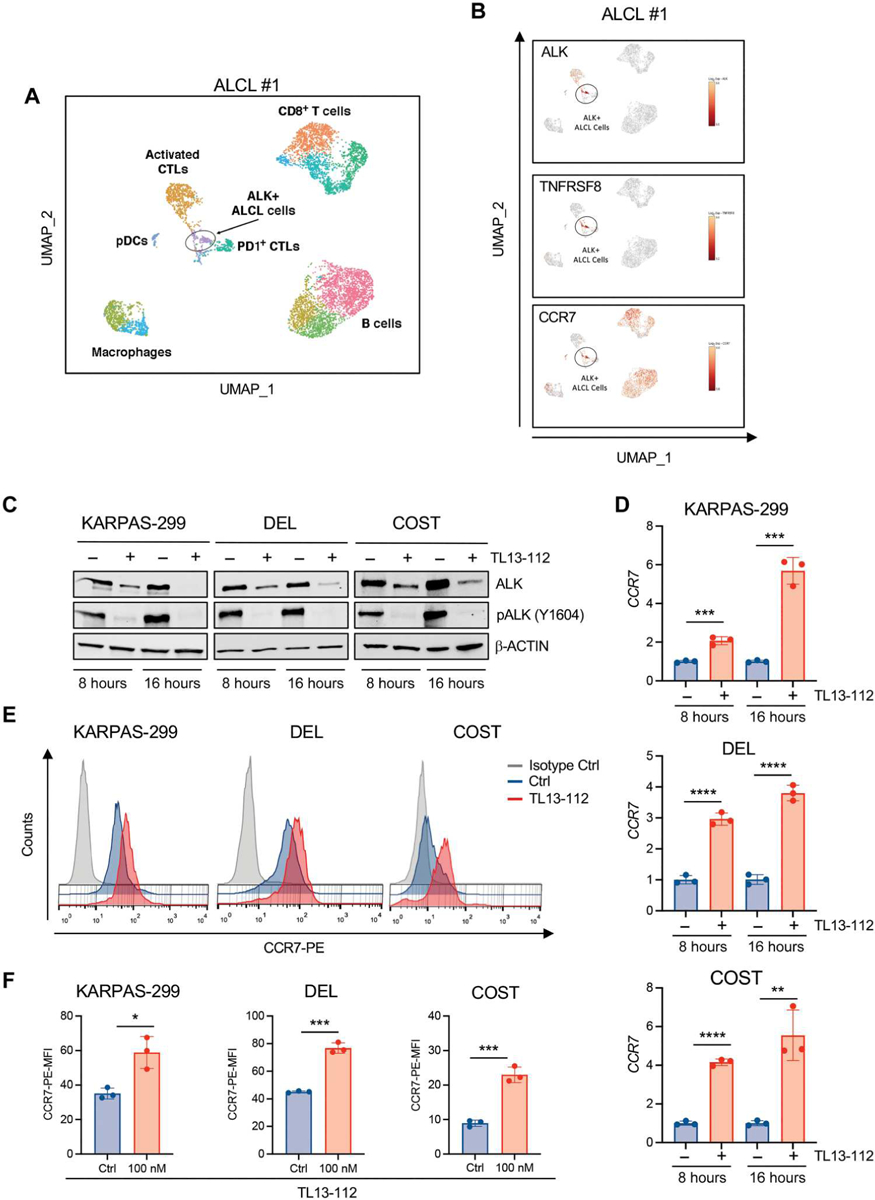
(A) Uniform Manifold Approximation and Projection (UMAP) plot of scRNA-seq data for CD45+ cells from a primary lymph node of a patient with ALK+ ALCL, color-coded by the main group of cell type. (B) UMAP plots [CD45+ cell positioning as shown in (A)] normalized for expression of selected genes. (C) Western blot analysis of high-PI3Kγ–expressing ALK+ ALCL cells treated with TL13–112 (100 nM). (D) qRT-PCR analysis of CCR7 mRNA expression performed on ALK+ ALCL cell lines treated with TL13–112 (100 nM). n = 3 technical replicates. (E) CCR7 cell surface expression intensity measured by flow cytometry in ALK+ ALCL cell lines treated with dimethyl sulfoxide or TL13–112 (100 nM). KARPAS-299 cells were treated for 24 hours and DEL and COST cells for 16 hours. (F) Histograms show mean fluorescence intensity (MFI) of CCR7 cell surface expression in ALK+ ALCL cells treated as in (E). *P < 0.05, **P < 0.01, ***P < 0.001, and ****P < 0.0001. Significance was determined by unpaired, two-tailed Student’s t test. Data are shown as means ± SD. For Western blots, β-actin was used as a loading control. Blots are representative of two independent experiments with similar results.