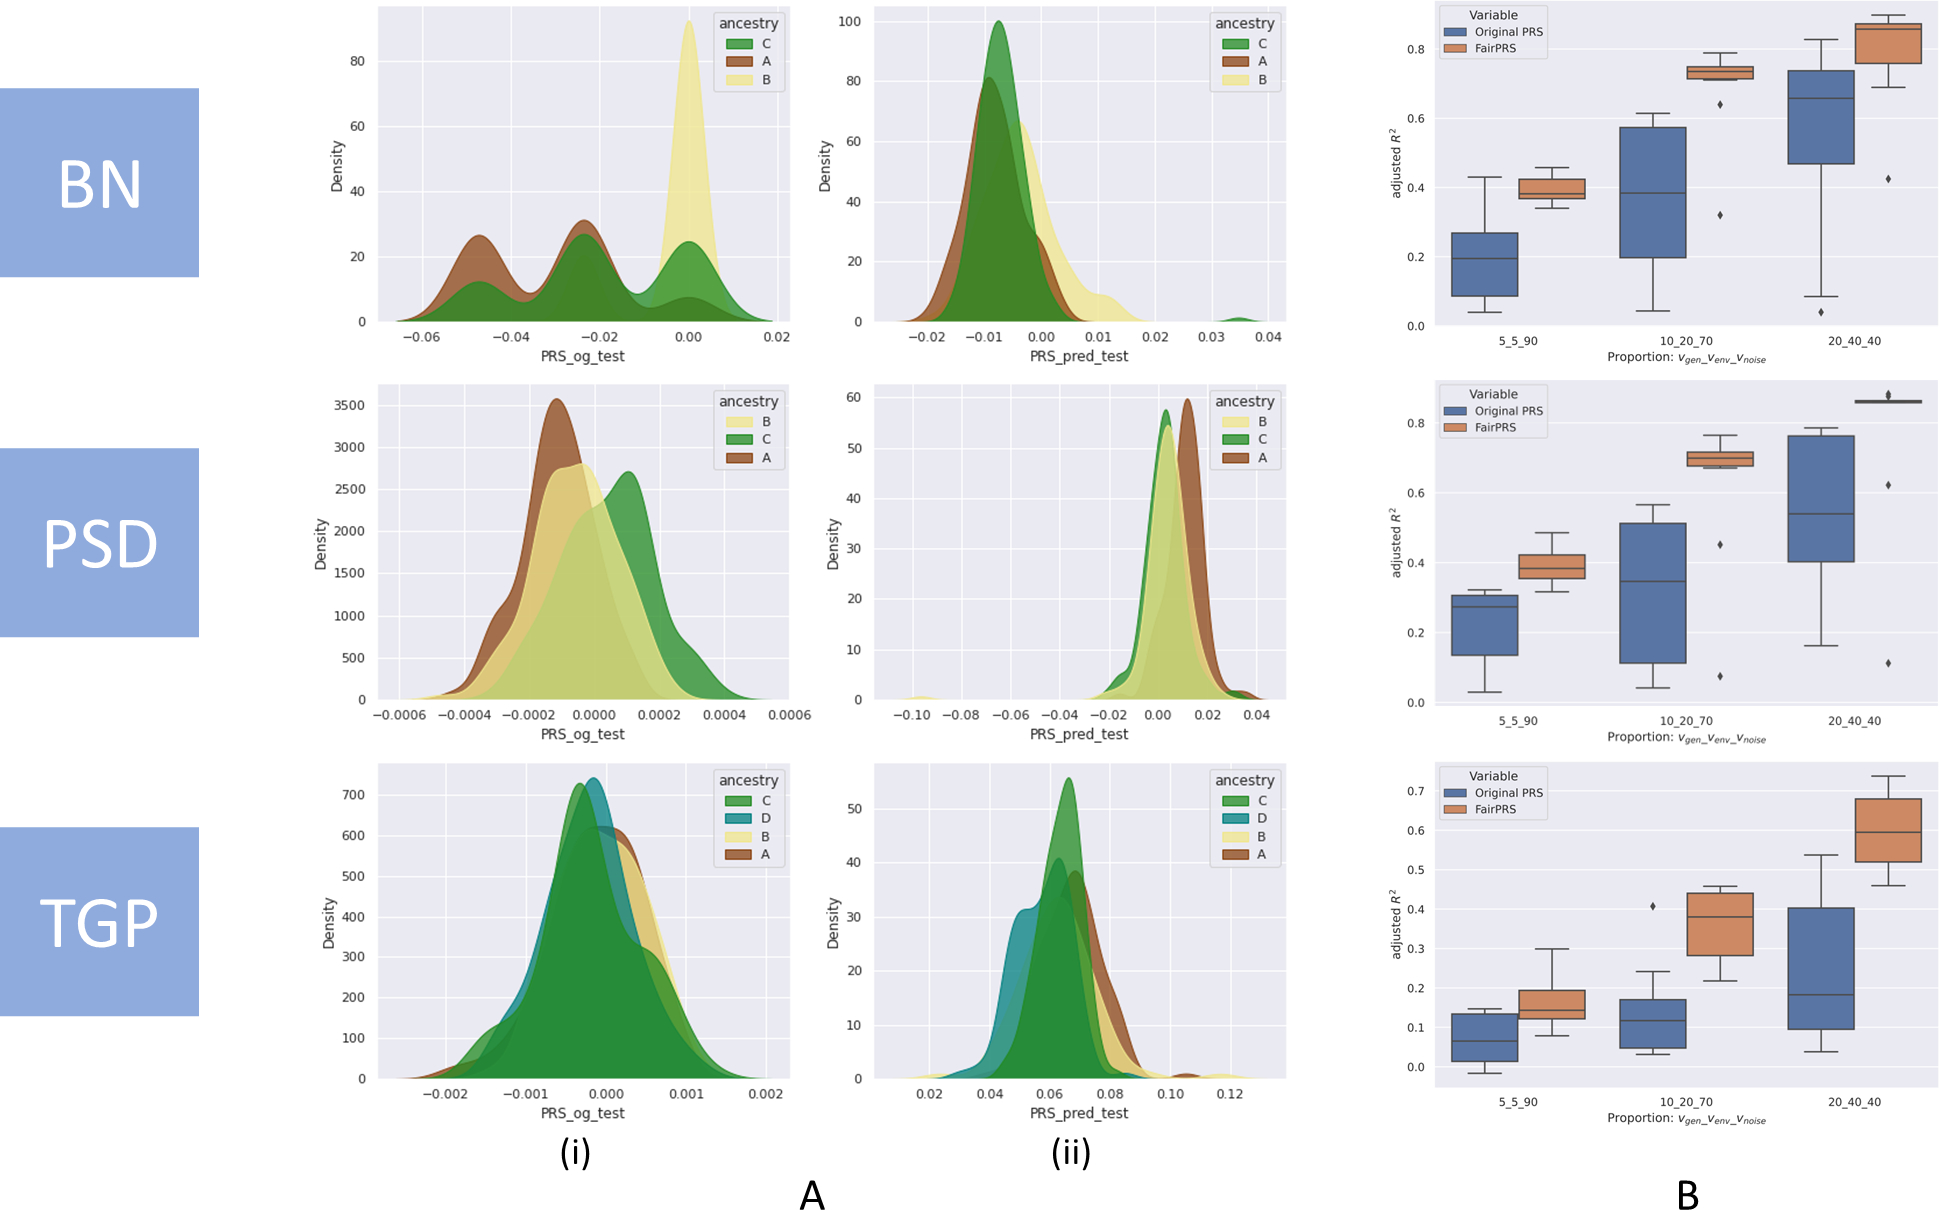
Fig. 2.

Simulation study results for three simulation models, BN, PSD and TGP. A. Distributions of ancestry-specific PRS computed by (i) PRSice2 and (ii) FairPRS. B. Box-and-whisker plot of adjusted R2 between the phenotype and PRS computed by PRSice2 and FairPRS across the variance proportions for .
