
Fig. 5.
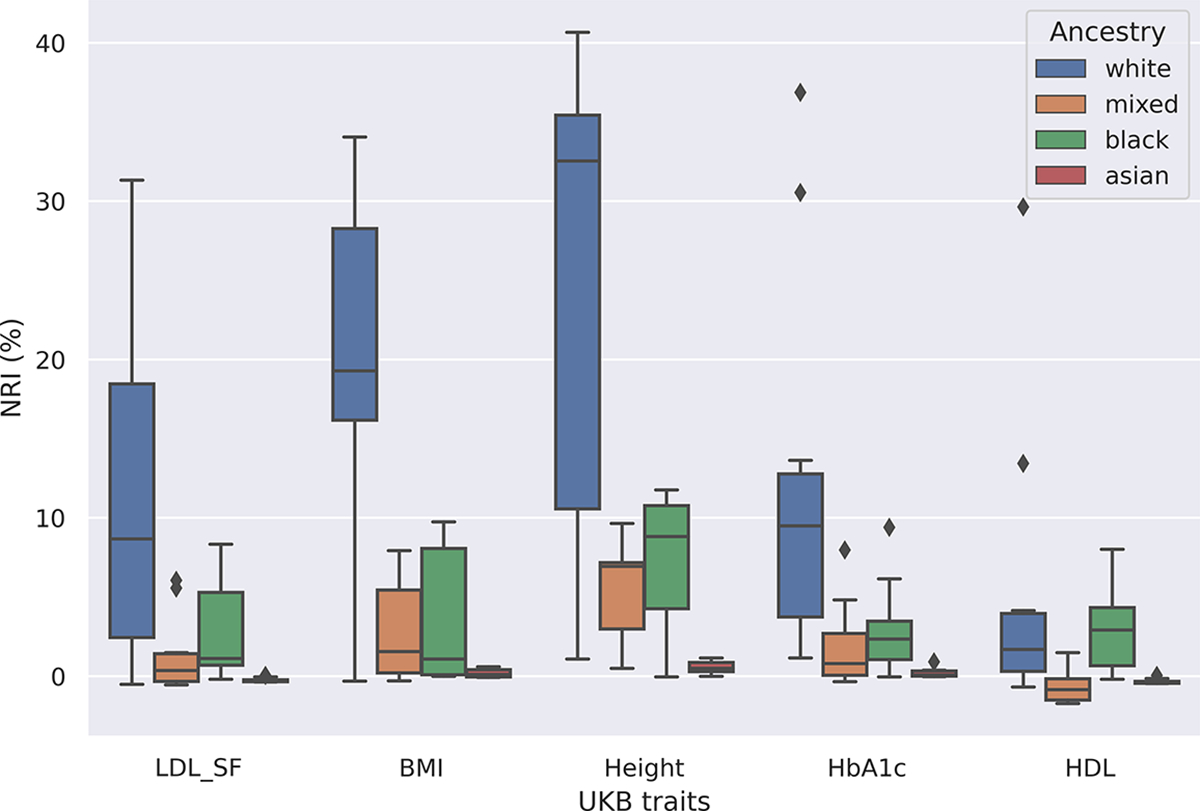
Applying FairPRS on UKB-ePRS estimates. Box-and-whisker plot of NRI (%) of adjusted R2 between the phenotype and PRS after using FairPRS from pre-computed PRS per ancestry group.
Official websites use .gov
A
.gov website belongs to an official
government organization in the United States.
Secure .gov websites use HTTPS
A lock (
) or https:// means you've safely
connected to the .gov website. Share sensitive
information only on official, secure websites.
Applying FairPRS on UKB-ePRS estimates. Box-and-whisker plot of NRI (%) of adjusted R2 between the phenotype and PRS after using FairPRS from pre-computed PRS per ancestry group.