. 2024 Jan 3;53(4):1794–1808. doi: 10.1039/d3dt03372d

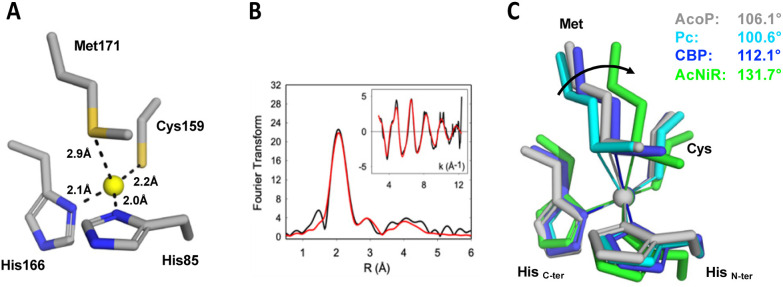
Fig. 3. Copper centre geometry of AcoP and comparison with other copper centres. (A) Geometry and distance between Cu and the ligands in the reduced state of wildtype AcoP copper site. (B) EXAFS spectroscopy of AcoP. Fourier transform and EXAFS (inset) for AcoP as isolated protein. Black traces are experimental data, red traces are simulated ones. The best fit (shown) was used to derive metrical details, listed in Table 2. (C) Overlay of the copper sites described for plastocyanin (Pc, PDB 1PLC, light blue), Cucumber Basic Protein (CBP, PDB 2CBP, dark blue), nitrite reductase (AcNiR, PDB 1NIF, green) and AcoP (PDB 7Z3B, grey). The arrow indicates the variation of the angle (C-termHis)N–Cu–S(Met) along the T1-to-T1.5 trajectory; the angle values are indicated for each structure.

Fig. 3