. 2024 Jan 3;53(4):1794–1808. doi: 10.1039/d3dt03372d

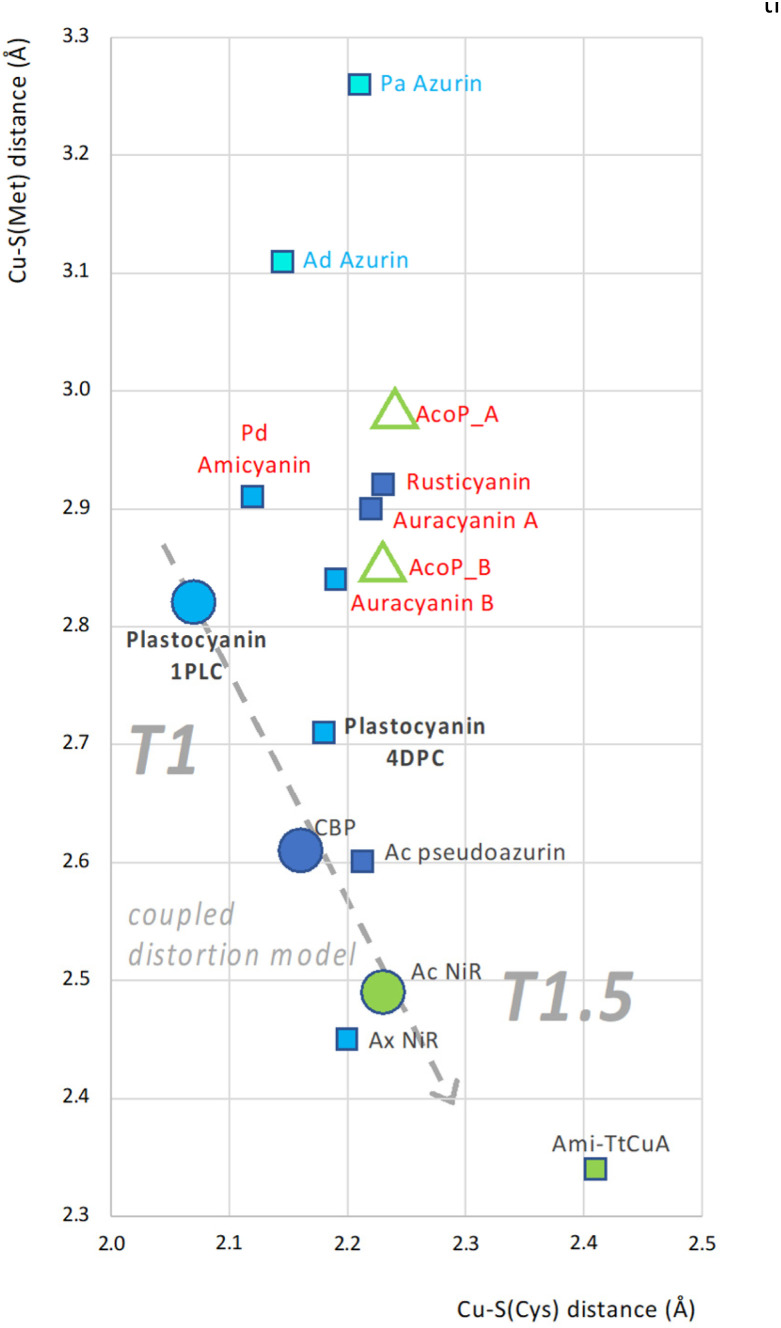
Fig. 6. CSC plot: correlation between Cu–S(Met) and Cu–S(Cys) bond lengths in a set of cupredoxins. Cu–S(Cys) and Cu–S(Met) bond lengths correspond to x and y coordinates of each dot. Each cupredoxin is represented by a square, except for AcoP (green triangles, relative to molecule A and B from the crystallographic asymmetric unit) and the three prototype representatives of the CDM; plastocyanin, CBP and AcNir (circles). Colouring of each shape represents the spectral features: pentacoordinated centres (light blue shapes); classical T1 blue (blue shapes); perturbed blue (dark blue shapes); and green T1.5 (green shapes). Labels (cupredoxin names) are coloured according to the apparent affiliation to one of three groups: Azurins (blue label text), cupredoxins in agreement with the CDM (black label text) and others (red label text). The T1-to-T1.5 trend of the coupled distortion group, including the prototypes plastocyanin, CBP and AcNir only is represented too (grey dashed arrow). Analysed structures: AcoP from Acidithiobacillus ferrooxidans (PDB: 7Z3B); Pa Azurin from Pseudomonas aeruginosa (PDB: 2CCW);72 Ad Azurin from Alcaligenes denitrificans (PDB: 2AZA);73 Pd Amicyanin from Paracoccus denitrificans (PDB: 2RAC);74 Ca Auracyanin A (PDB: 2AAN) and B (PDB: 1QHQ) from Chloroflexus aurantiacus;75 Af Rusticyanin from Acidithiobacillus ferroxidans (PDB: 2CAK);76 Plastocyanin from Populus nigra, bold (PDBs: 1PLC and 4DPC);77 Ac Pseudoazurin from Achromobacter cycloclastes (PDB: 4YLA);78 CBP from Cucumis sativus (PDB: 2CBP);79 AxNir from Achromobacter xylosoxidans (PDB: 1 OE1);80 AcNir from Achromobacter cycloclastes (PDB: 2BW4);63 Ami-TtCuA chimera (PDB: 5U7N).67.

Fig. 6