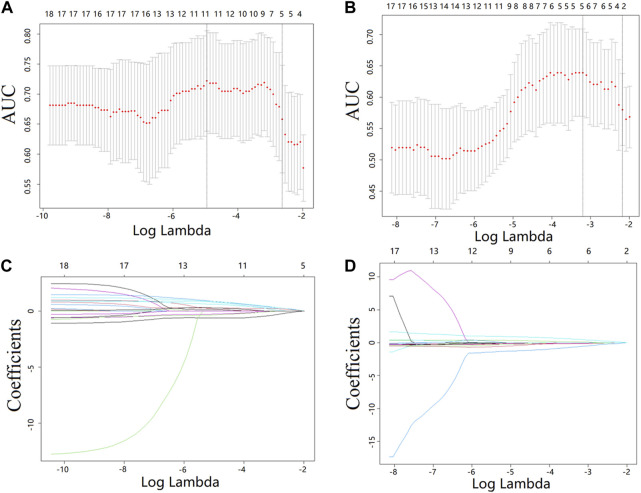
FIGURE 4.
Feature selection from the T1CE MRI data with LASSO. (A,B) LASSO coefficient analysis of the features with 10-fold cross-validation to select optimal lambda for predicting the Ki-67 level (A) and HER-2 status (B). (C,D) LASSO coefficients against the lambda, with five and two nonzero coefficients generated from the T1CE MRI data for predicting the Ki-67 level (C) and HER2 status (D), respectively.

