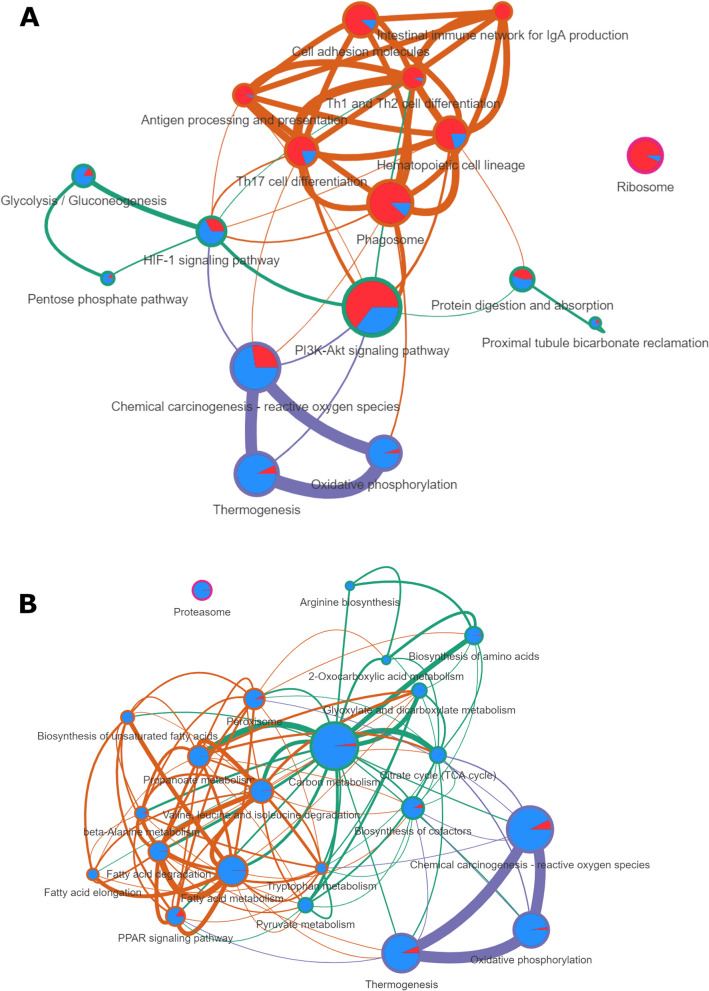
Fig. 4.
Enrichment network. A Enrichment network for the muscle. The orange cluster brings together terms related to the immune system. Purple cluster links thermogenesis and pathways related to oxidative stress. The green cluster is more related to energy homeostasis regulation. B Enrichment network for the SCAT. A purple cluster brings together Thermogenesis and pathways related to oxidative stress. A green cluster is mainly associated with energy metabolism pathways, and an orange cluster is more related to fatty and amino acid (AA) pathways. The size of the edges is proportional to the number of genes in common between two terms. The size of the nodes represent the number of DEGs in this term. A pie chart inside each node represents the proportion of up-regulated (red) and down regulated (blue) genes

