Fig. 1.
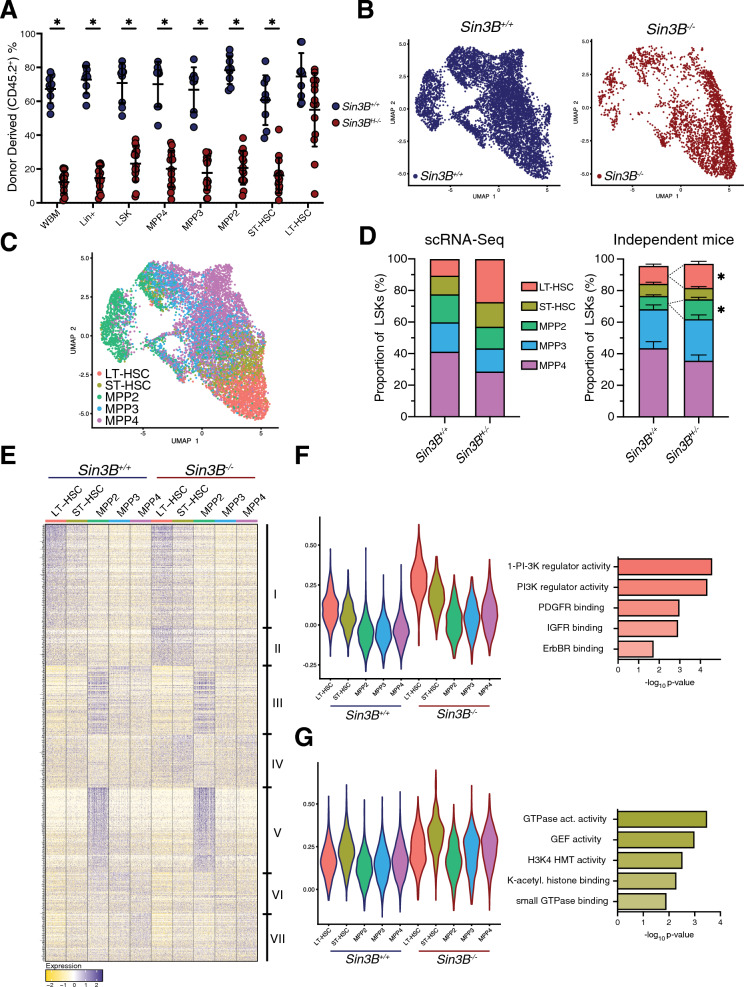
Sin3B regulates discrete transcriptional programs in hematopoietic subsets at homeostasis. A Analysis of whole bone marrow from recipient mice 8 weeks after competitive transplantation. Quantification of donor derived (CD45.2) cells in the hematopoietic compartments indicated via flow cytometry. Asterisks indicate statistical significance. (2way ANOVA, Šidák’s multiple comparison’s test; *p < 0.0001; Data are represented as mean ± SEM) Sin3BF/F recipients n = 9; Sin3B−/− recipients n = 14. B Two-dimensional Uniform Manifold Approximation and Projection (2D UMAP) with LSK cells colored by genotype as determined by hashtag oligo analysis. Left: Sin3B+/+ cells. Right: Sin3B−/− cells. LSKs were sorted from 4 mice, 2 for each genotype. C 2D UMAP demonstrating supervised clustering of hematopoietic subsets recovered from scRNA-Seq. D Left panel: quantification of various LSK subsets in scRNA-Seq. Right panel: Quantification of same subset in the bone marrow of independent mice by flow cytometry. Asterisks indicate statistical significance (Student’s t-test with multiple comparison correction; *p < 0.05; data shown as mean ± SEM) (n = 9). E Differentially expressed genes between all cell types was calculated via Seurat’s FindAllMarkers function utilizing the MAST statistical framework. Clusters of genes visually identified are denoted on the right. Expression is scaled and centered. F Left panel: Violin Plot showing average expression of Cluster II genes for indicated hematopoietic subtypes. Right panel: Gene Ontology Analysis of Cluster II genes. G Left panel: Violin Plot showing average expression of Cluster IV genes for indicated hematopoietic subtypes. Right panel: Gene Ontology Analysis of Cluster IV genes

