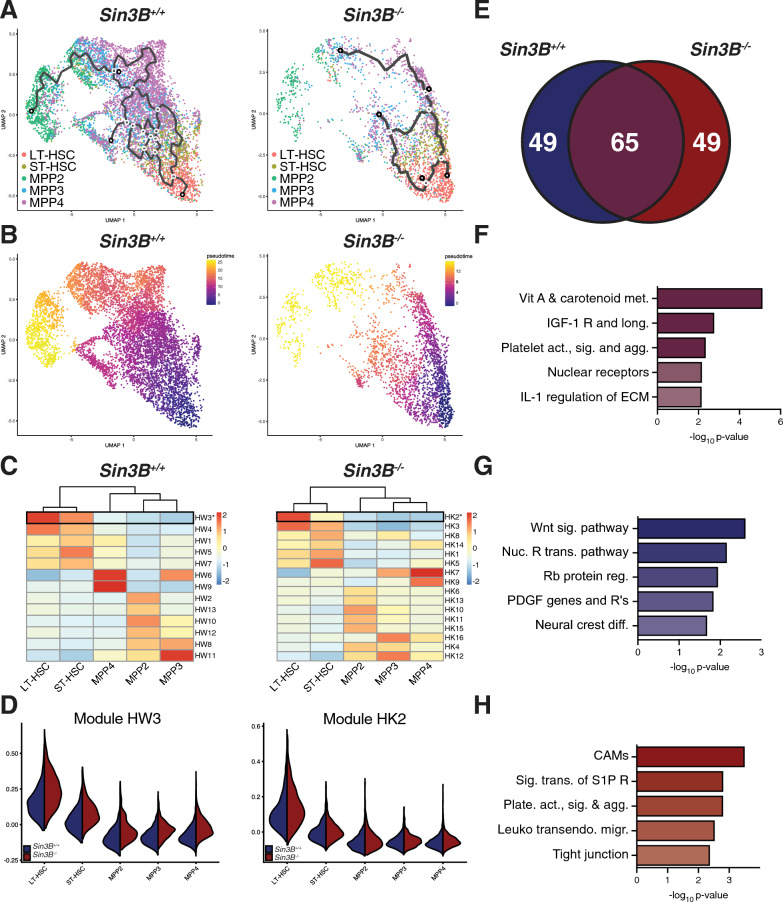
Fig. 2.
Pseudotime analysis of LSKs at homeostasis demonstrates a defective transition between LT- and ST-HSCs in the absence of Sin3B. A Two-dimensional UMAP projection of LSKs showing trajectories calculated from Monocle3. Left panel: Sin3B+/+, Right panel: Sin3B−/−. B Using LT-HSCs as a starting node, pseudotime was calculated for each genotype to determine transcriptional programs as a function of differentiation. C Differentially expressed genes as a function of pseudotime were calculated and grouped into modules based on expression pattern. Shown is the average expression of each module in the indicated cell type. D Expression of highlighted modules in Sin3B+/+ and Sin3B−/− subsets. E Venn diagram showing overlap of genes obtained from module HW3 and HK2. Purple color denotes overlap, blue denotes wild-type, and red denotes knockout. F Gene Ontology Molecular Function was carried out for the indicated gene list and shown are GO terms recovered plotted by p-value for 65 genes shared bewteen Sin3B+/+ and Sin3B-/- LT-HSCs. G GO Molecular Function was carried out for 49 genes unique to Sin3B+/+ LT-HSCs. H GO Molecular Function was carried out for 49 genes unique to Sin3B−/− LT-HSCs

