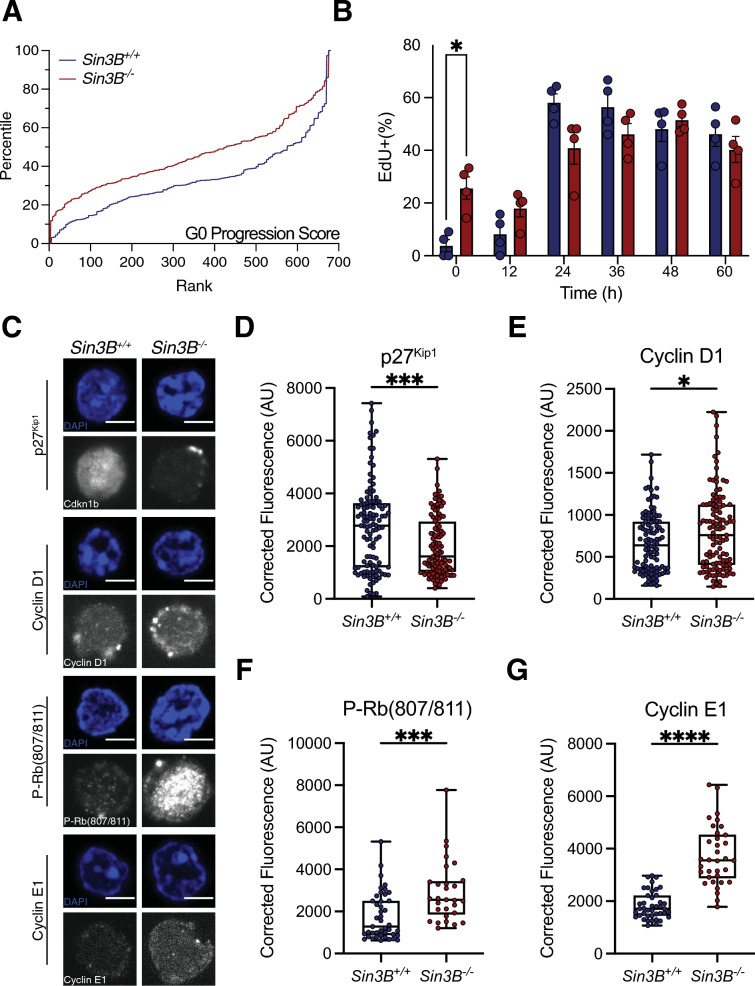
Fig. 4.
Ablation of Sin3B results in spurious cell cycle progression in LT-HSCs. A G0 scores for LT-HSCs were calculated and cells were ranked and data transformed into percentile to normalize for cell number. B EdU labeling of cycling LT-HSCs from indicated genotypes at various timepoints via immunofluorescence. Asterisks indicate statistical significance (2-way ANOVA, Šidák’s multiple comparison’s test; *p < 0.05; data shown as mean ± SEM. n = 4 per genotype. C LT-HSCs were isolated from Sin3BF/F or Sin3BH−/− animals via FACS and processed for immunofluorescence and quantification of indicated cell cycle proteins. Scale bars represent 5 µm. Signal was quantified within the nucleus of individual cells utilizing DAPI as a mask. Representative immunofluorescence from sorted LT-HSCs of indicated proteins. Images were acquired on a Zeiss LSM 700 Laser Scanning Confocal using a 63× plan apochromat 1.4 oil objective mounted with oil at room temperature. Alexa Flour 488 and Alexa Fluor 594 were the fluorochomes conjugated to primary antibodies against indicated target protein. Zen software was utilized on the microscope to acquire images, with analysis done in FIJI to measure fluorescence intensity. All fluorescence was corrected for using background readings and data was exported to Prism9 for statistical analysis. D Quantification of Cdkn1b(p27Kip1) in LT-HSCs. E Quantification of Cyclin D1 in LT-HSCs. F Quantification of Phospho-Rb(S807/811) in LT-HSCs. G Quantification of Cyclin E1 in LT-HSCs. Outliers were identified with the ROUT method (Q = 1%). Asterisks indicate statistical significance (2-tailed unpaired t-test; *p < 0.05; ***p < 0.0001; ****p < 0.00001). n = 4 mice per genotype

