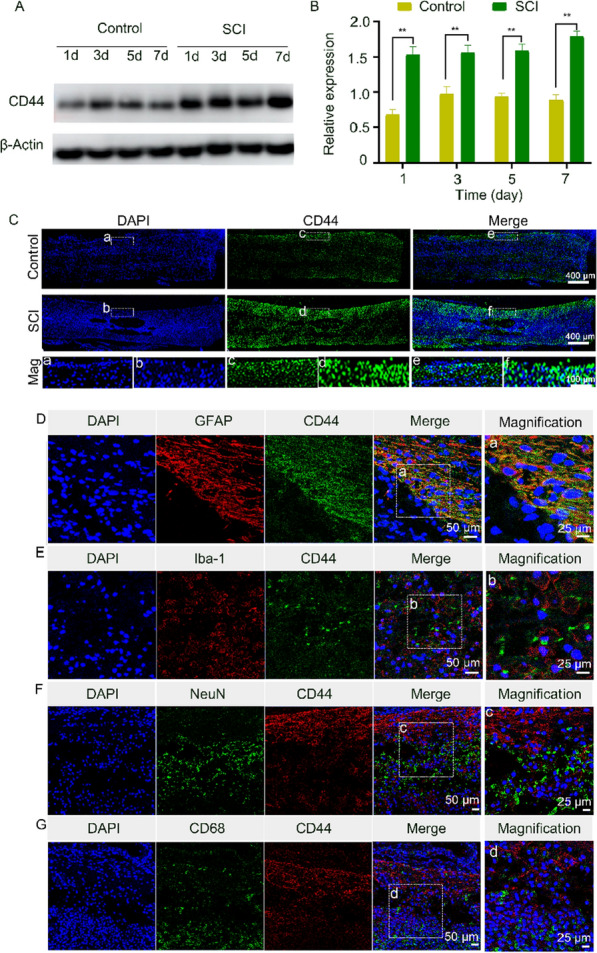
Fig. 3.

CD44 expression in the injured spinal cord. A Representative western blot images of CD44 expression in the control and SCI groups. B Densitometric analysis of CD44 levels based on data in (A). **P < 0.01 in comparison to the control group. C CD44 immunofluorescence staining of injured spinal cord samples. Mag: Magnification. D Immunofluorescence staining of injured spinal cord samples for GFAP (red) and CD44 (green). E Immunofluorescence staining of injured spinal cord samples for CD44 (green) and Iba-1 (red). F Immunofluorescence staining of injured spinal cord samples for NeuN (green) and CD44 (red). G Immunofluorescence staining of injured spinal cord samples for CD68 (green) and CD44 (red)
