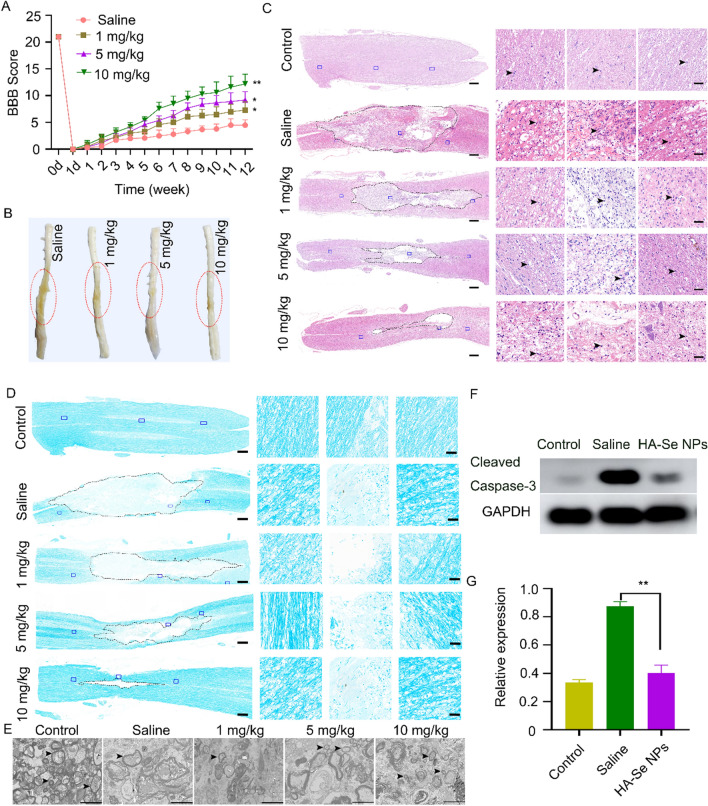
Fig. 5.
Neuroprotective effects of HA-Se NPs. A Basso Beattie Bresnahan (BBB) scores of SCI rats. B Gross images of the spinal cord in different groups at 12 weeks post-injury. The lesion site is denoted by the red circle. C Images of hematoxylin and eosin (H&E) right, three magnified images of the areas marked by the blue squares. Scale bars = 500 and 50 μm, respectively. Dotted line and arrows indicate the lesion cavity and inflammatory cells, respectively. D Images of an injured spinal cord stained with LFB. Scale bars = 500 and 50 μm, respectively. Dotted line indicates the lesion cavity. E Representative TEM images of different experimental groups after treatment with saline or HA-Se NPs at the indicated concentrations. Scale bar = 2 μm. Arrows indicate myelin sheaths. F Western blot analysis of cleaved caspase-3 in injured spinal cord tissues 24 h after injury. GAPDH was used as the internal control. G Densitometric analysis of cleaved caspase-3 levels based on (D). **P < 0.01 in relation to the saline group

