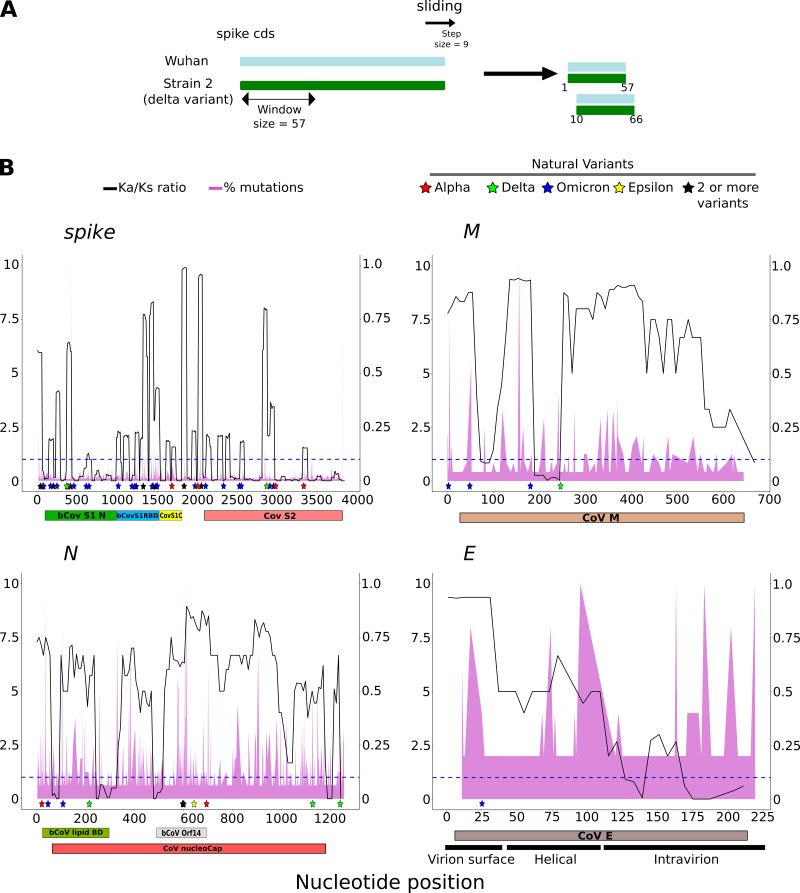
Fig 4.
Ka/Ks ratio distribution along the sequence of structural genes. (A) Ka/Ks ratio is calculated from each pairwise alignment of each gene in a window of 57 nucleotides. The window slides in nine nucleotide steps, and the complete profile is finally plotted along the entire length of the gene. For the E gene, a window of 30 with a slide of 6 was used, due to its short length. (B) Distribution of Ka/Ks along the length of genes S, M, N, and E (black line). The percentage of mutations per position obtained from Nextstrain database is also shown for comparison (https://nextstrain.org/ncov/gisaid/global/6m). The primary Y-axis represents the Ka/Ks ratio, and the secondary Y-axis represents the percentage of mutations in relative value. In addition, VOC from the Outbreak.info database (colored stars), and the Pfam domains have been included (below): S → bCovS1N (PF16451, betacoronavirus-like spike glycoprotein S1, N-terminal), bCoV_S1_RBD (PF09408, betacoronavirus spike glycoprotein S1, receptor binding), CoV_S1_C (PF19209, coronavirus spike glycoprotein S1, C-terminal), CoV_S2 (PF01601, coronavirus spike glycoprotein S2); M → CoVM (PF01635, coronavirus M matrix/glycoprotein); N → bCoV_lipid_BD (PF09399, betacoronavirus lipid binding protein), bCoV_Orf14 (PF17635, betacoronavirus uncharacterized protein 14), CoV_nucleocap (PF00937, coronavirus nucleocapsid); E → CoVE (PF02723, coronavirus small envelope protein E). The blue line marks the Ka/Ks value of 1.

