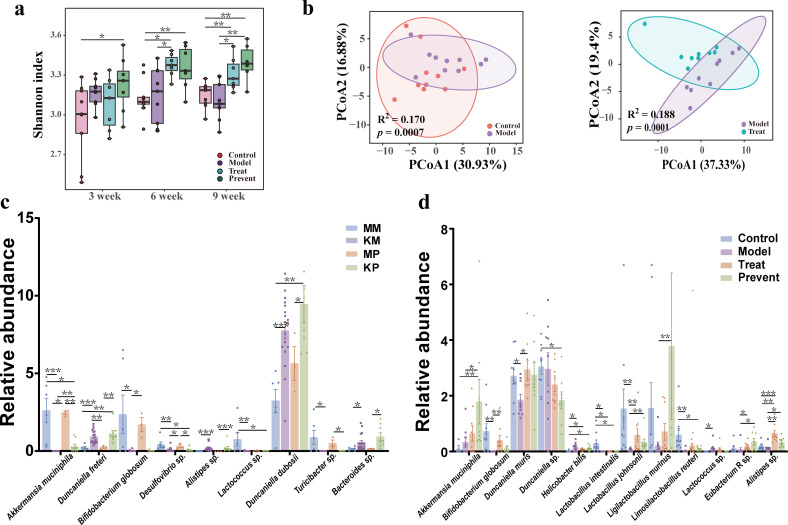
FIG 2.
Effect of Probio-M8 on the gut microbiota of mice. (a) Shannon index for each group of mice throughout the experimental cycle. Data are plotted as ±standard deviation. (b) Species-level PCoA based on weighted UniFrac distances with the Adonis test. (c) The abundance of gut microbiota at the species level in mothers and 3-week-old littermates. MM stands for mothers in the model group; KM stands for littermates in the model group; MP stands for mothers in the prevention group; and KP stands for littermates in the prevention group. Data are plotted as ±standard error of the mean. (d) The abundance of gut microbiota at the species level between groups of 9-week-old littermates. Data are plotted as ±standard error of the mean. The Wilcoxon rank-sum test with Bonferroni correction was used for multiple pairwise comparisons. *, p < 0.05; **, p < 0.01; and ***, p < 0.001.

