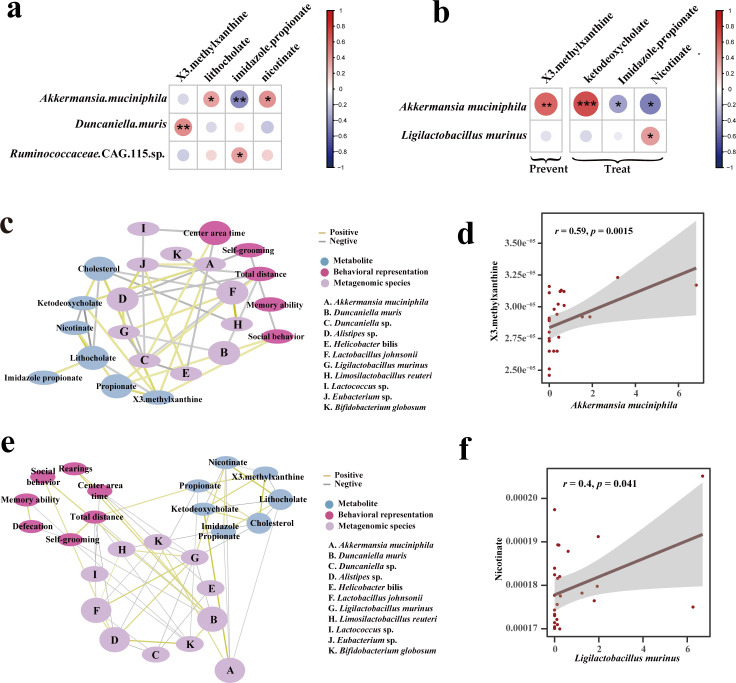
FIG 6.
Correlation analysis. (a) Correlation heatmap of metabolite and gut microbiota in 3-week mice (red: positive correlation; blue: negative correlation). (b) Correlation heatmap of metabolites and gut microbiota in 9-week mice. (c) Correlation network diagram of metabolites, behavioral representation, and gut microbiota in 9-week prevent group mice. (d) Regression plot of key metabolite and gut microbiota correlations in mice in the 9-week prevent group. (e) Correlation network diagram of metabolites, behavioral representation, and gut microbiota in 9-week treat group mice. (f) Regression plots of key metabolite and gut microbiota correlations in mice in the 9-week treat group. In the correlation analysis, all are plotted based on the Spearman index. Where the width of the network diagram connecting lines is proportional to the strength of the correlation (yellow: positive; gray: negative).

