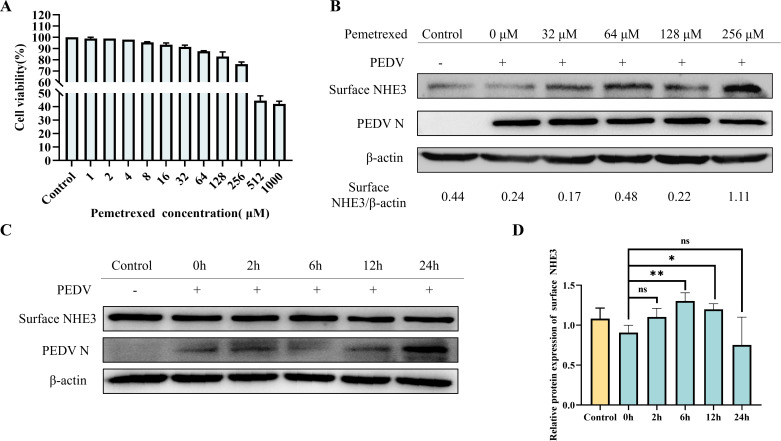
Fig 6.
Screening of Pemetrexed for optimal treatment concentration and pretreatment time. (A) Statistical plot of cell viability after treatment with different concentrations of Pemetrexed. (B) Western blotting results of surface NHE3 protein levels after treatment with different concentrations of Pemetrexed in the presence of PEDV infection. (C) Western blotting results of surface NHE3 protein levels at different time points after Pemetrexed treatment in the presence of PEDV infection. (D) Quantitative analysis of surface NHE3 levels at different time points after Pemetrexed treatment in the presence of PEDV infection.

