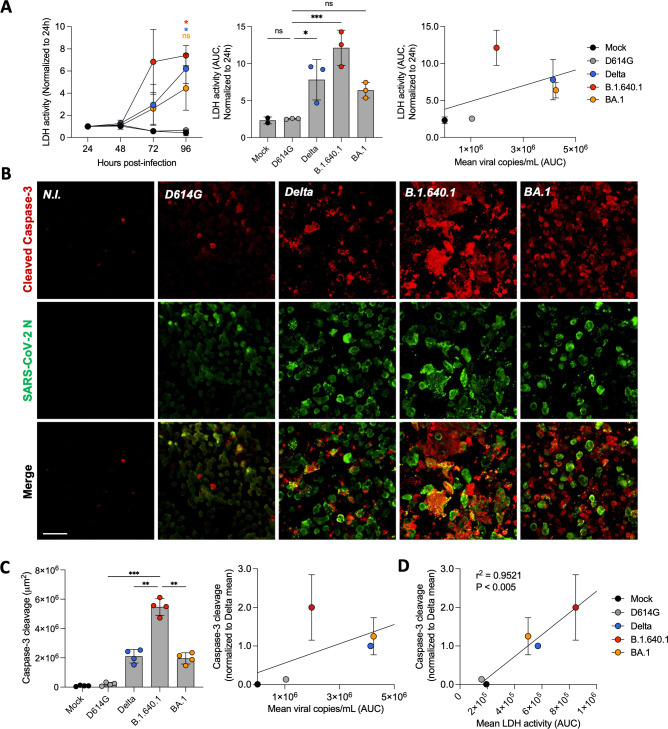
Fig 6.
Cytopathic effects of hNEC infection with B.1.640.1. (A) LDH release from apical side of hNEC ALI culture over the time course of infection with respective SARS-CoV-2 variants (n = 3/4; left). Area under the curve (AUC) representation of LDH activity, bars represent mean values (middle). Linear regression analysis of LDH release (AUC) compared to viral copies/mL (AUC) from 96 hours of infection with respective SARS-CoV-2 variants (right). Asterisk colours represent respective variants. (B) Immunofluorescence of hNECs stained for cleavage products of caspase-3 and SARS-CoV-2 nucleoprotein. Shown is one field of each variant. Scale bar = 40 µm. (C) Quantification of total area of cleavage products of caspase-3. Each data point represents one randomly assigned field from a single biological repeat (left). An ordinary one-way ANOVA test was performed with Tukey’s multiple comparison test to compare D614G to respective variants, *P < 0.05, ***P < 0.0001, ns = not significant. Linear regression analysis of caspase-3 cleavage from two biological repeats (total number of fields = 8) normalized to Delta compared to mean viral copies/mL (AUC) 96 hpi (right). (D) Linear regression analysis of caspase-3 cleavage normalized to Delta compared to LDH activity (AUC) over 96 hours of infection. Error bars represent SD.

