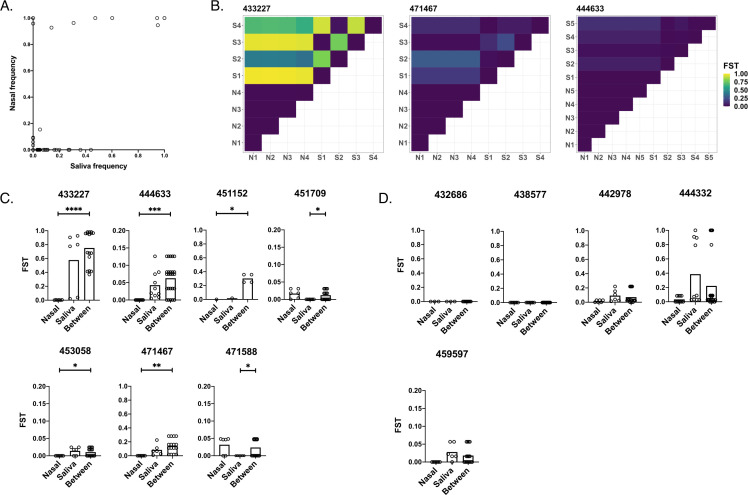
Fig 4.
Quantification of genetic compartmentalization of virus between sample sites. (A) Comparison of iSNV frequencies between matched samples in saliva and nasal environments (Pearson correlation, r = 0.615, P < 0.001). (B) Representative heatmaps exemplifying compartmentalization. Maps show FST values between pairs of samples from nasal (“N”) and/or saliva (“S”) environments (numbered by order of sampling). (C) Participants exhibiting compartmentalization (one set of within-environment FST values is lower than between-environment FST values). (D) Participants exhibiting no significant compartmentalization (neither set of within-environment FST values is lower than between-environment FST values). Scales range from 0 to 1 or 0 to 0.2 depending on the spread of the data. Asterisks indicate levels of significance (*P < .05, **P < .01, ***P < .001, ****P < .0001). P-values are derived from Monte Carlo permutation tests.

