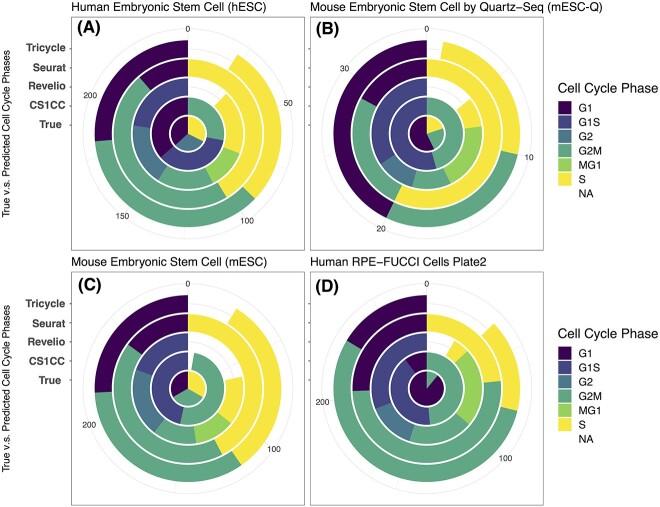
Figure 1.
Pie charts showing the distribution of true and predicted cell cycle phases. The center of each chat exhibits the actual cell cycle phases that were experimentally labeled. The outer circles of the chart display the phases that were predicted by four different methods: CS1CC, Revelio, Seuret and Tricycle (from inside to outside). Phase G1, G1S, G2, G2M, MG1, S and NA are plotted counterclockwise. Four scRNA-seq data sets are used: (A) hESC; (B) mESC-Q; (C) mESC; and (D) human RPE-FUCCI cells (plate 2).

