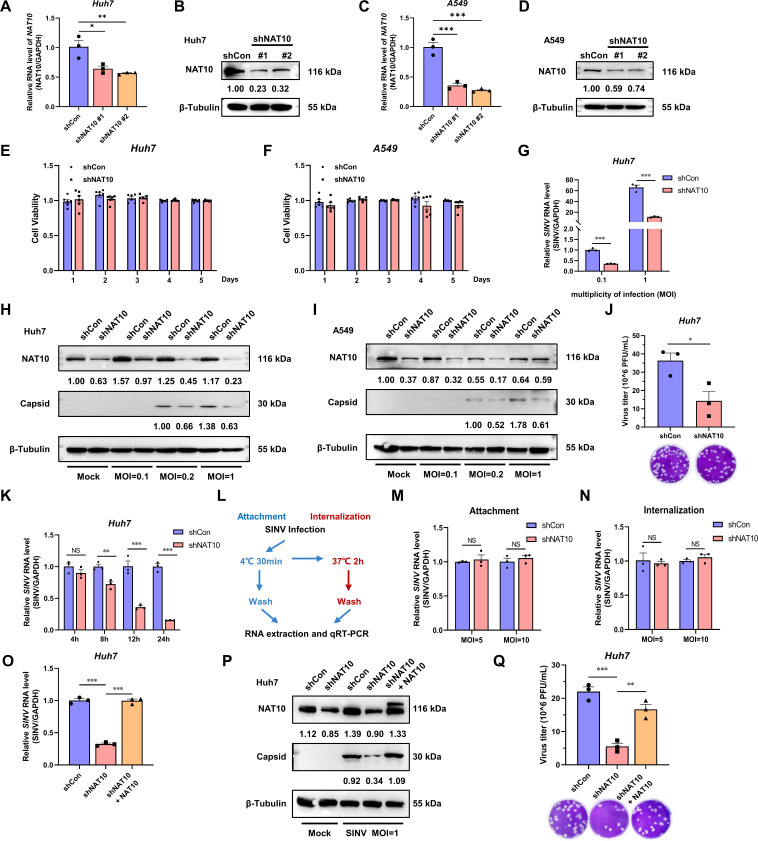
Fig 2.
NAT10 is required for SINV replication. (A) qRT-PCR analysis of NAT10 mRNA expression in NAT10 stable-KD Huh7 cells. (B) Immunoblot analysis of NAT10-KD Huh7 cells. shNAT10 #2 was used in the subsequent experiments. (C) qRT-PCR analysis of NAT10 mRNA expression in NAT10-KD A549 cells. (D) Immunoblot analysis of NAT10-KD A549 cells. shNAT10 #2 was used in the subsequent experiments. (E, F) NAT10-KD Huh7 (E) cells were evaluated with the A549 (F) and control cells using the CCK8 assay for a period of 5 days, during which the 10% CCK8 solution was added at the same time each day, and the absorbance values of each well were detected after 4 h of incubation in the dark (n = 6). (G) qRT-PCR analysis of the SINV RNA expression levels in the NAT10-KD Huh7 cells at 24 hpi (MOI = 0.1 and 1). (H, I) Immunoblotting of the SINV capsid protein abundance in the control and NAT10-KD Huh7 (H) and A549 (I) cells at 24 hpi (MOI = 0.1, 0.2, and 1). (J) SINV infectious virion abundance in Vero E6 cells infected with a 10-fold dilution of NAT10-KD Huh7 cell supernatant (MOI = 1); counted following 1% crystal violet staining after 96 h. (K) Huh7 NAT10-KD and control cells were infected with SINV (MOI = 5), and the SINV RNA was assessed using qRT-PCR at 4, 8, 12, and 24 hpi. (L) Flowchart showing the viral attachment and internalization assay. (M) Attachment assay. SINV RNA was analyzed using qRT-PCR in Huh7 NAT10-KD and control cells infected with SINV (MOI = 5 and 10) for 30 min at 4°C. (N) Internalization assay. SINV RNA was analyzed using qRT-PCR in Huh7 NAT10-KD and control cells infected with SINV (MOI = 5 and 10) for 2 hpi at 37°C. (O, P) NAT10-KD Huh7 cells exogenously transfected with Myc-tagged NAT10-expressing plasmid and infected with SINV (MOI = 1), qRT-PCR analysis of the SINV RNA expression (O); immunoblot analysis of the SINV capsid protein level (P) was conducted at 24 hpi. (Q) SINV infectious virions in the culture supernatant determined via a plaque formation assay as described for panel (P). Blots were quantified with ImageJ software and normalized to control levels. Data are presented as the means ± SEM (n = 3). *P ≤ 0.05, **P ≤ 0.01, ***P ≤ 0.001, and NS, not significant (A, C, O, and Q, one-way ANOVA with Tukey’s multiple comparisons test; G, K, M, and N, two-way ANOVA with Bonferroni post-test; J, unpaired Student’s t-tests).

