Fig 3.
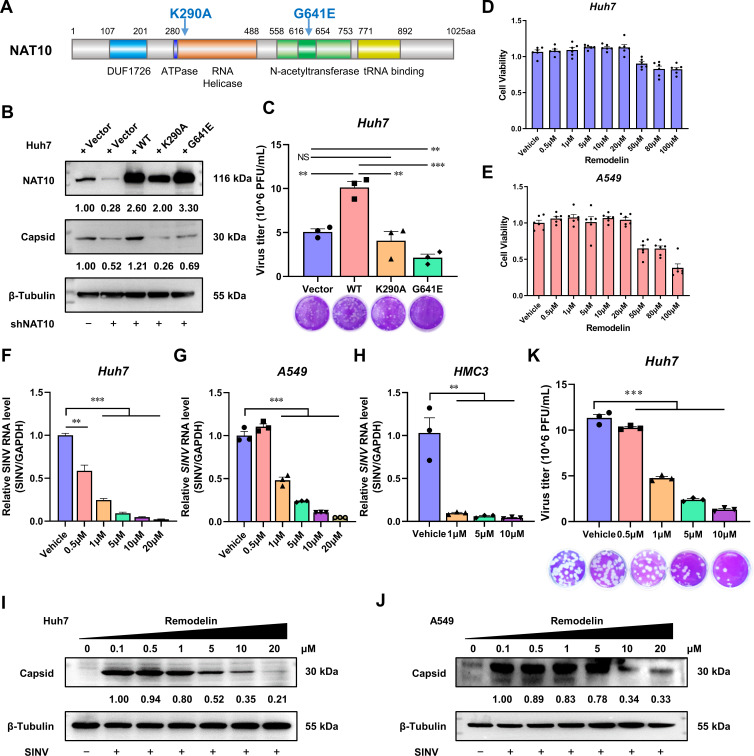
N-Acetyltransferase activity is required for NAT10 to support SINV infection. (A) Schematic diagram showing the RNA helicase and N-acetyltransferase domains of NAT10. (B) Immunoblotting of the control or NAT10-KD Huh7 cells transfected with plasmids expressing the WT NAT10, K290A mutant, or G641E mutant and infected with SINV for 24 h (MOI = 1). (C) Plaque formation assay of the SINV infectious virions in the culture supernatant of panel B. (D, E) Viability of Huh7 (D) and A549 (E) cells at 24 hpi with the Remodelin incubation at different doses, detected using the CCK8 assay. (F) qRT-PCR analysis of the SINV RNA expression levels in Huh7 cells infected with SINV and treated with different concentrations of Remodelin (MOI = 1). (G) qRT-PCR analysis of SINV RNA expression levels in A549 cells infected with SINV and treated with different concentrations of Remodelin (MOI = 1). (H) qRT-PCR analysis of the SINV RNA expression levels in HMC3 cells infected with SINV and treated with different concentrations of Remodelin (MOI = 1). (I) Immunoblotting of the SINV capsid protein in Huh7 cells infected with SINV for 24 h and treated with different concentrations of Remodelin (MOI = 1). (J) Immunoblotting of the SINV capsid protein in A549 cells infected with SINV for 24 h and treated with different concentrations of Remodelin (MOI = 1). (K) Plaque formation assay using the SINV infectious virions in the culture supernatant from the Huh7 cells infected with SINV and treated with different concentrations of Remodelin (MOI = 1). Blots were quantified with ImageJ software and normalized to control levels. Data are presented as the means ± SEM (n = 3). **P ≤ 0.01, ***P ≤ 0.001, and NS, not significant (C, F, G, H, and K, one-way ANOVA with Tukey’s multiple comparisons test).

