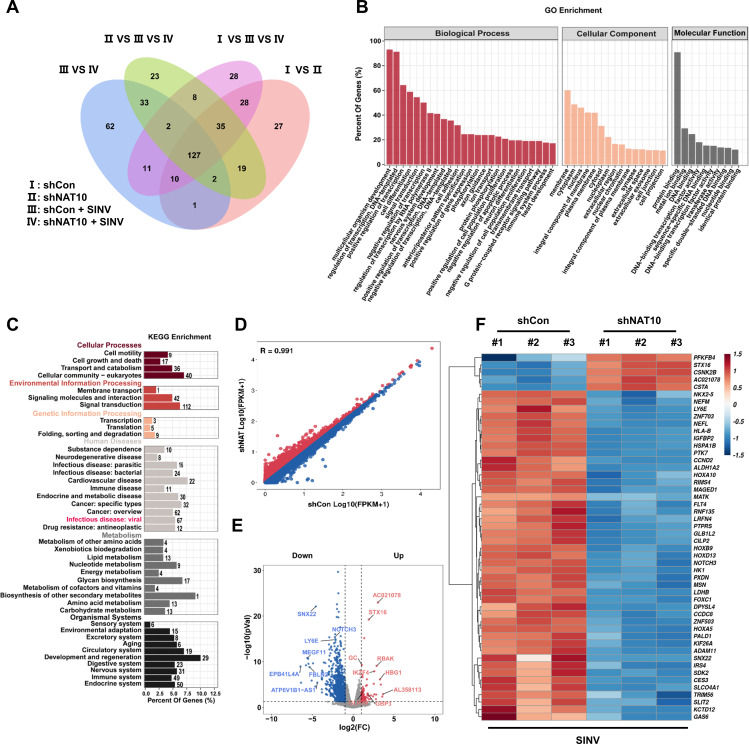
Fig 4.
Identification of the NAT10 targets using RNA sequencing. (A) Venn diagram showing four Huh7 cell comparison groups with DEGs. (B) Functional annotation and pathway enrichment analysis results of predicted downstream target genes of NAT10 are shown. All DEGs were mapped to GO terms in the Gene Ontology database. Gene numbers were calculated for each term, and significantly enriched GO terms for the DEGs compared to those in the background genome were defined using the hypergeometric test. GO terms with a P < 0.05 were defined as significantly enriched GO terms in the DEGs. The horizontal axis represents the different GO functional categories, and the vertical axis represents the number of genes within that category as a percentage of the total number of genes for the annotation. (C) KEGG enrichment analysis revealed that the DEGs are primarily enriched in infectious diseases. The horizontal coordinate is the percentage of differential genes annotated to the pathway for all differential genes with annotations; the vertical coordinate is the name of the KEGG pathway enriched in differential genes. The bar graphs are colored separately to show the classification of the KEGG pathway. (D) Scatter plots of the differential mRNA expression determined from the RNAseq data. Red dots denote upregulated genes, and blue dots denote downregulated genes. (E) Volcano plot showing genes with upregulated (red) and downregulated (blue) expression in NAT10-KD cells infected with SINV. Log2 (FC) is the horizontal coordinate, representing the fold change in differential expression of genes across samples; −log10 (P value) is the vertical coordinate, representing the significance of the change in expression of the DEGs. (F) Heat map showing differential expression clusters for the top 50 genes in NAT10-KD Huh7 cells infected with SINV. The horizontal coordinate is the sample, and the vertical coordinate is the screened DEGs. The change in color from blue to white to red indicates expression from low to high. Red and blue indicate genes with high and low expressions, respectively.

