. 2024 Jan 23;132(1):015003. doi: 10.1289/EHP13402

Figure 2.

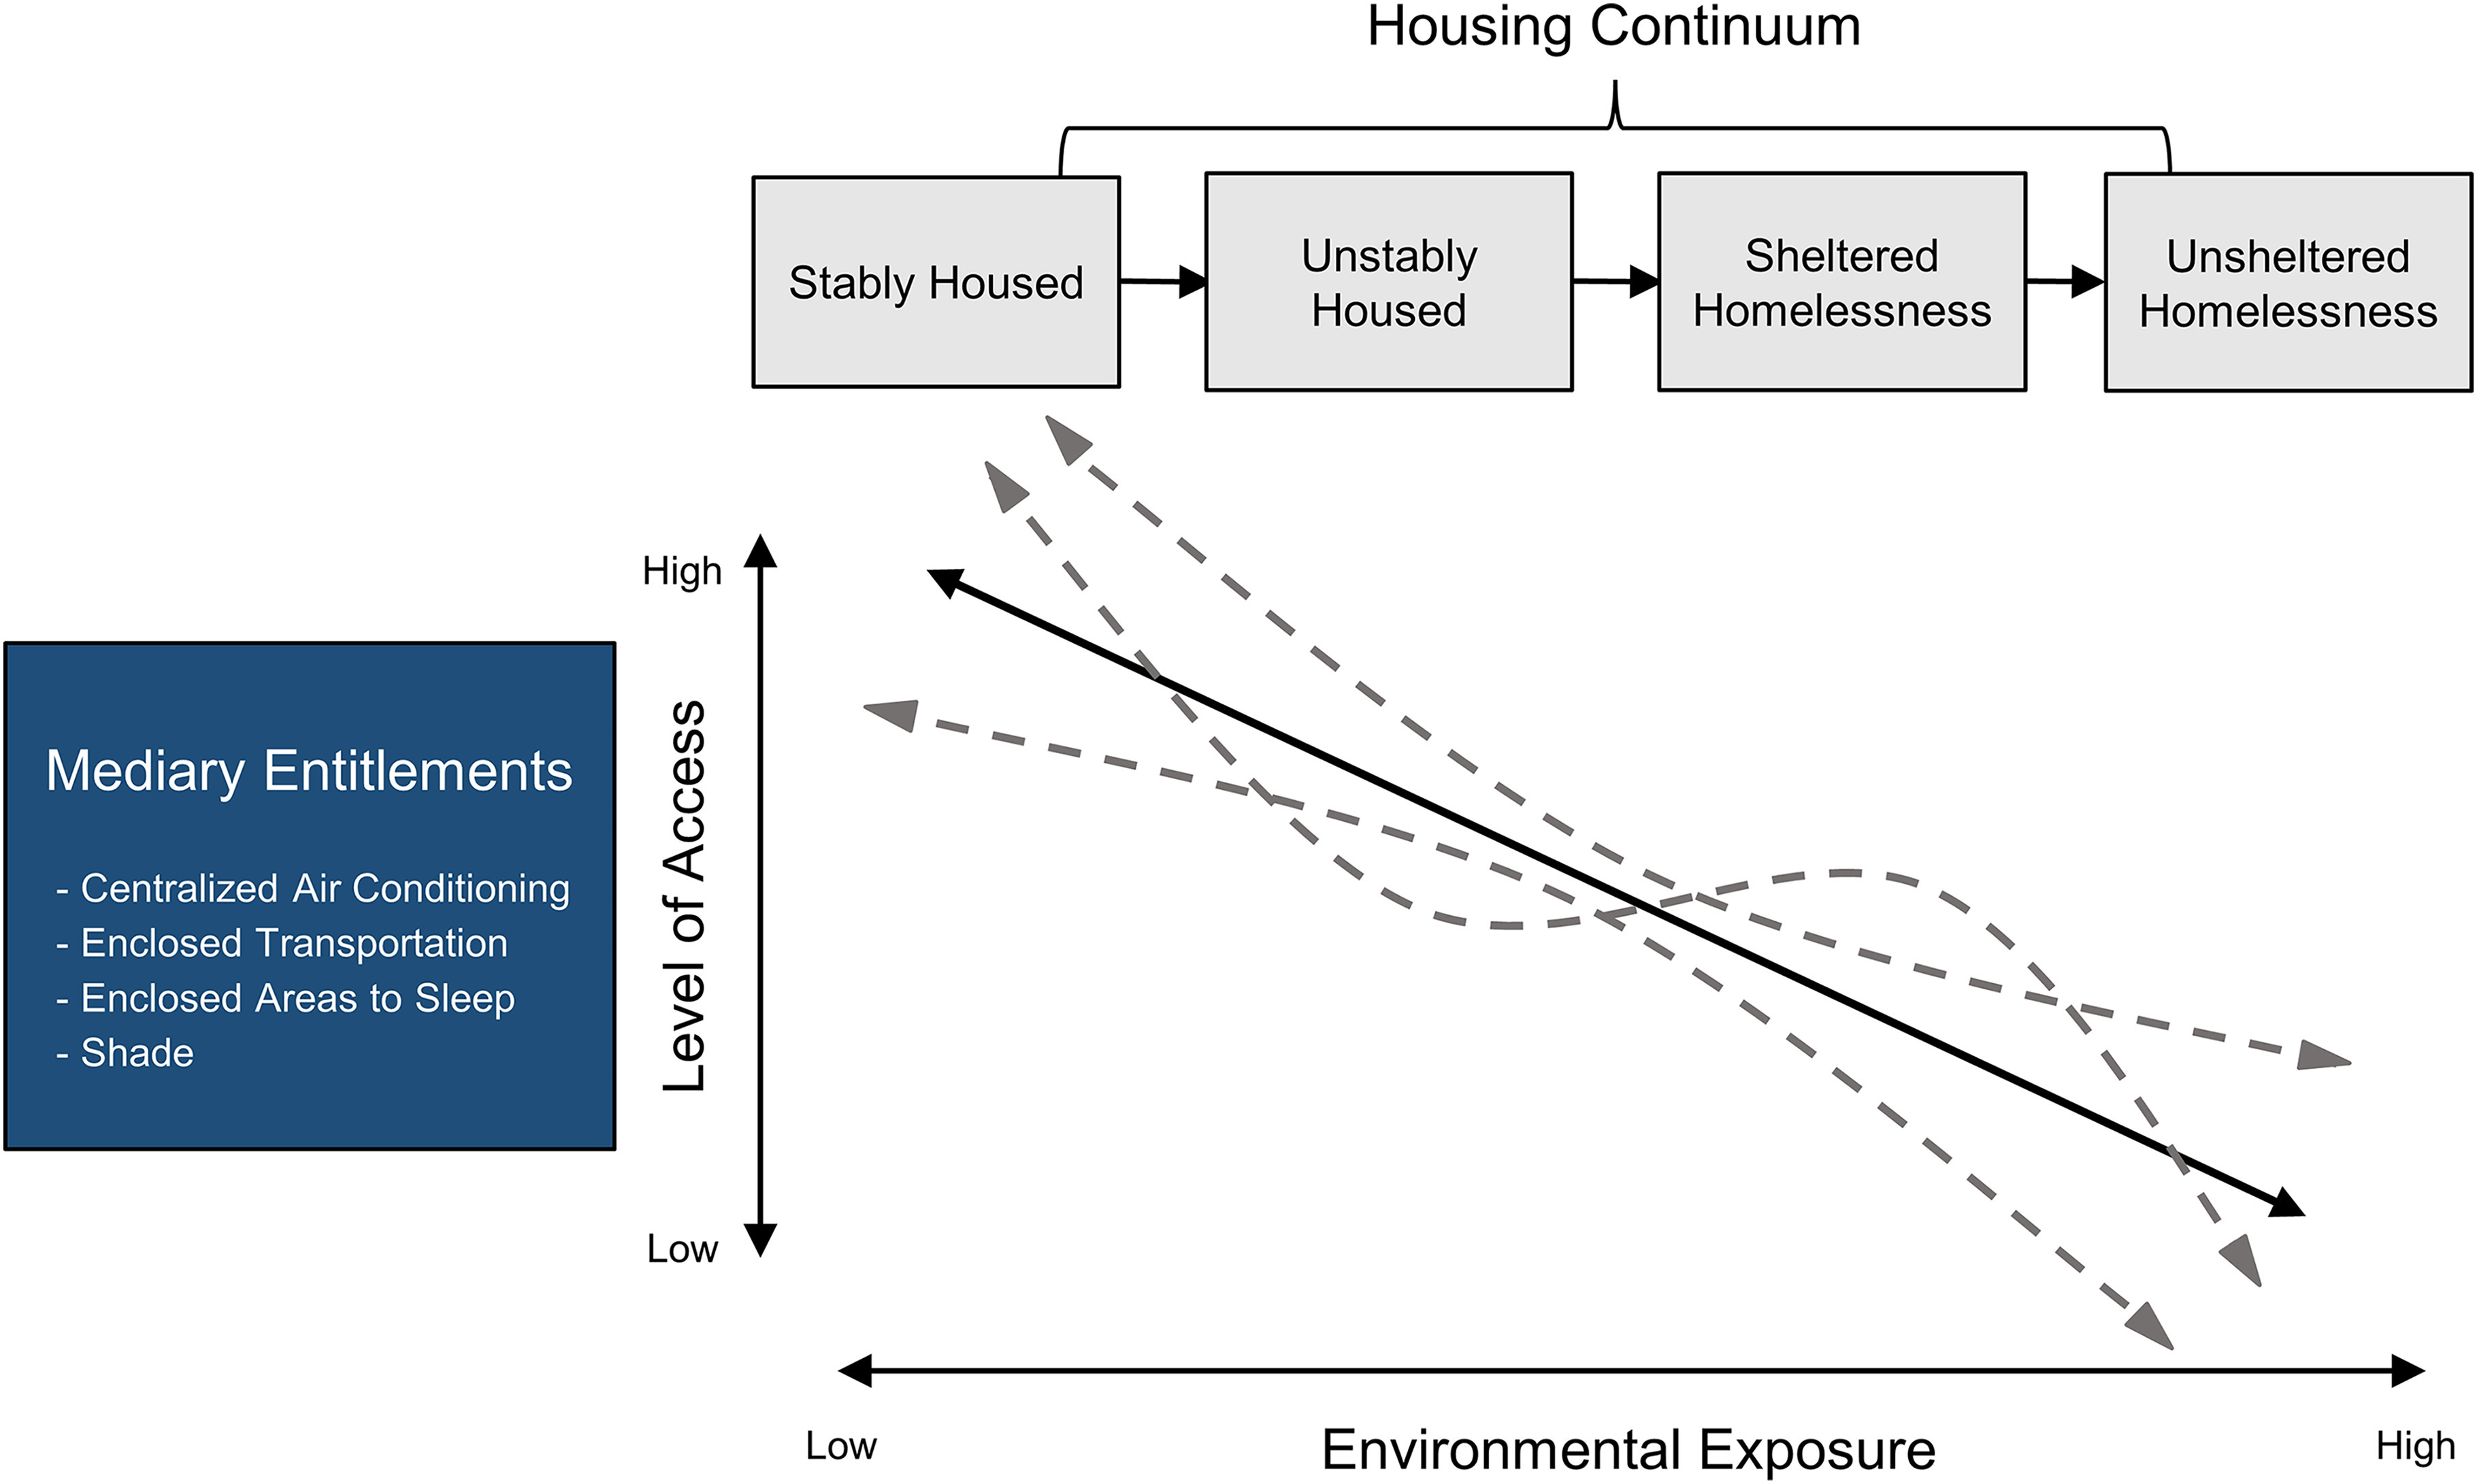
Figure 2 is a set of one flowchart and one line graph. The flowchart has two steps. Step 1: Housing continuum leads to stably housed, unstably housed, sheltered homelessness, and unsheltered homelessness. Step 2: Stably housed leads to unstably housed, unstably housed leads to sheltered homelessness, and sheltered homelessness leads to unsheltered homelessness. The line graph plots level of access, ranging from low to high (y-axis) across environmental exposure, ranging from low to high (x-axis) for mediary entitlements, including centralized air conditioning, enclosed transportation, enclosed areas to sleep, and shade.

Heat and air pollution exposure as a function of housing status. The diagram illustrates how access to mediating factors (i.e., resources to help an individual cope with environmental hazards) differs based on housing status, impacting environmental exposures (such as heat and air pollution). The solid line denotes the assumption of decreasing access to mediary factors as housing status destabilizes. The dashed, curved lines depict the multitude of lived actualities when considering the role of intersectional identity characteristics (e.g., race, sex, income, disease, etc.) that coexist with housing status to create lived experiences.