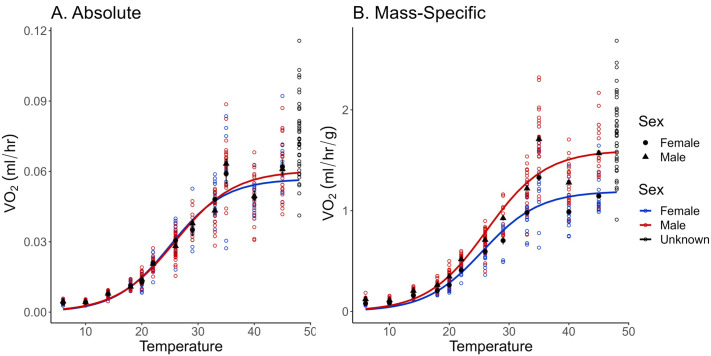
Fig. 4.
V̇O2 for female and male bees measured by the optical oxygen sensor system in objective 2. Pupae at 48°C were unable to complete development are represented by black open circles, because we were unable to determine sex. Those bees are not included in the regression. There was a significant difference in both absolute (A; two-way ANOVA, F11,445=1160, P<0.0001) and mass-specific (B; two-way ANOVA, F1,434=239, P<0.0001) V̇O2 across temperatures. (A) No statistical differences (F1,445=0.0464, P=0.830) were detected between absolute V̇O2 of female and male pupae across Ta (n=40 bees per temperature). (B) Mass-specific V̇O2 between sexes was significantly different across temperatures (n=40 bees per temperature). The number of males and females differed across temperatures (see Materials and Methods). Open colored circles indicate individual bee measurements, while the black circles and triangles represent the mean±s.e.m.

