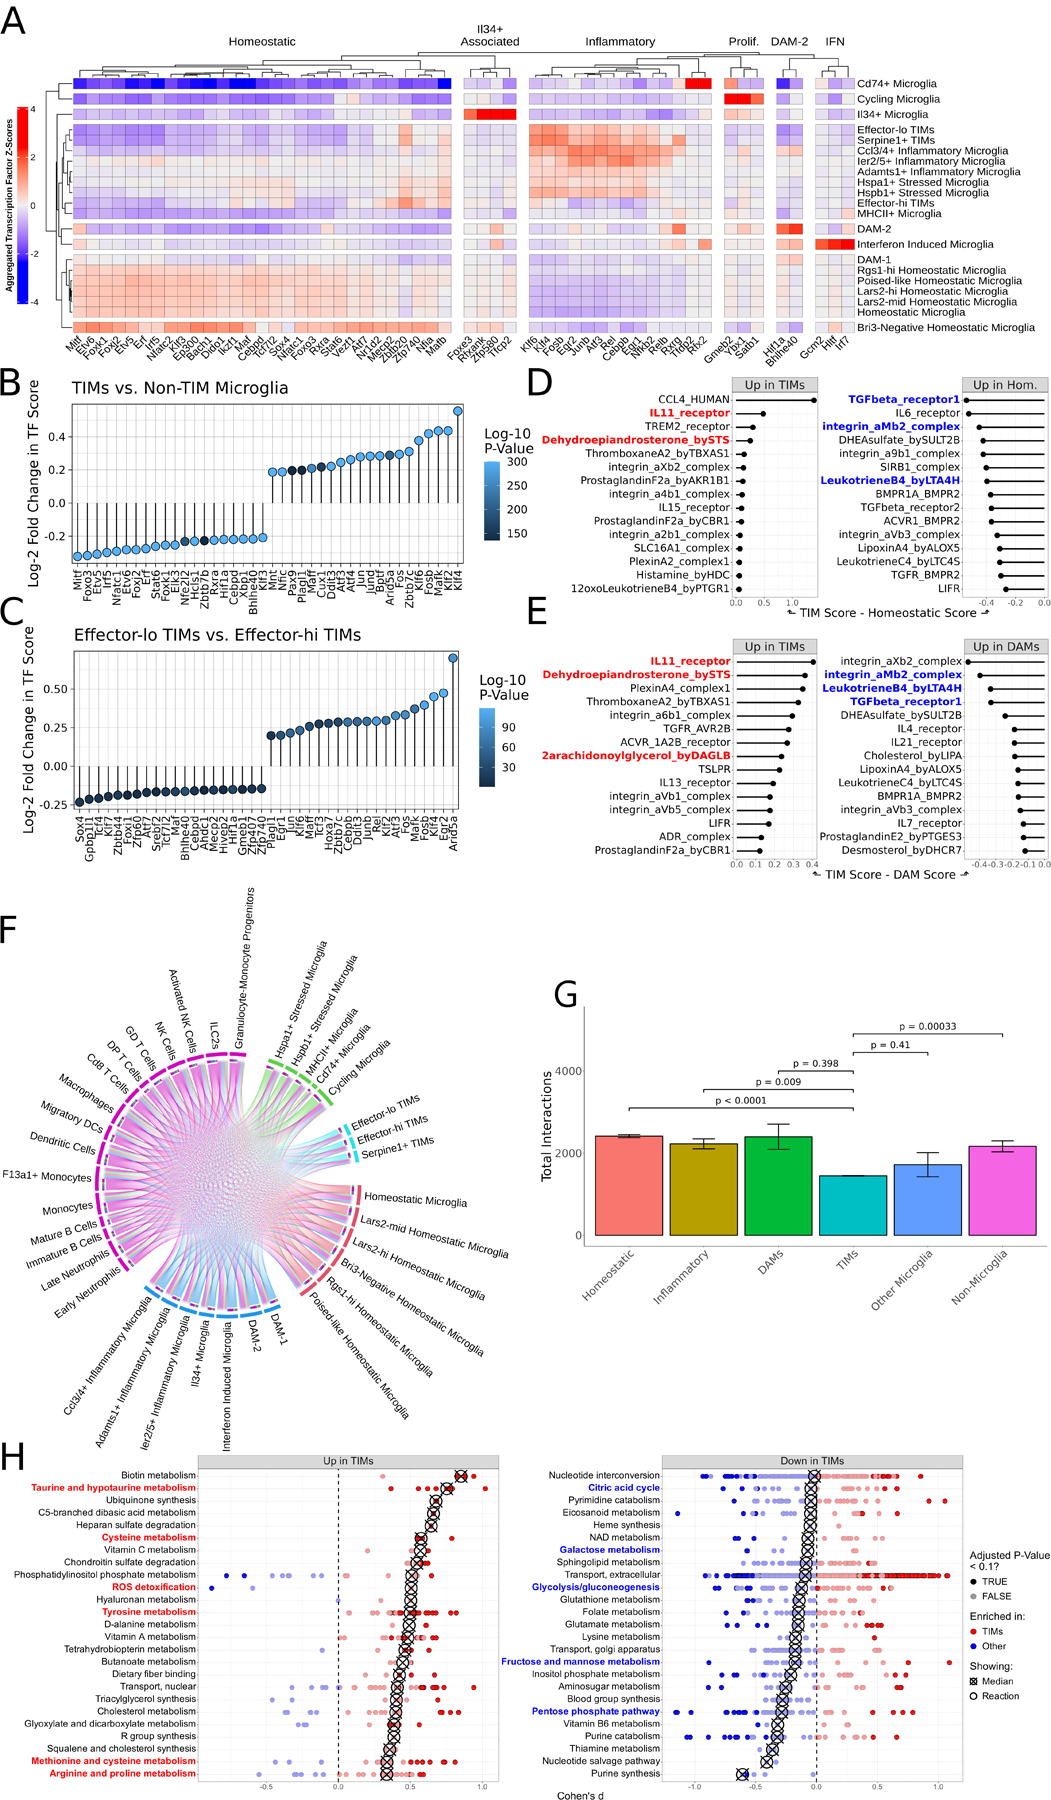
Figure 2: TIMs are defined by a unique transcriptional program, interactome, and metabolic state.

(A) Heatmap of SCENIC-derived regulons per cluster, filtered to most highly variable transcription factors. (B) Lollipop plot of differentially enriched SCENIC-derived regulons between TIMs and all non-TIM microglia. Positive values indicate increased strength in TIMs. (C) Same as (B) but comparing effector-lo TIMs to effector-hi TIMs. Positive values indicate increased strength in effector-lo TIMs. (D) CellPhoneDB scores for ligand:receptor complexes, comparing TIMs and homeostatic microglia. (E) Same as (D) but comparing TIMs and DAMs. (F) Circos plot of the atlas interactome. Size of outermost bars represents number of interactions, divided into cluster-by-other and other-by-cluster. (G) Barplot showing the total number of interactions predicted to be made by each cluster. Superclusters follow the same division as in (F). Bars are means ± standard error, significance evaluated by Welch’s t-test. (H) Dot plot of the Cohen’s d of Compass scores for metabolic pathways, comparing TIMs to non-TIM microglia. Each point represents a reaction within the larger subsystem; subsystems are sorted by median enrichment value. Medians are indicated by crossed points.
