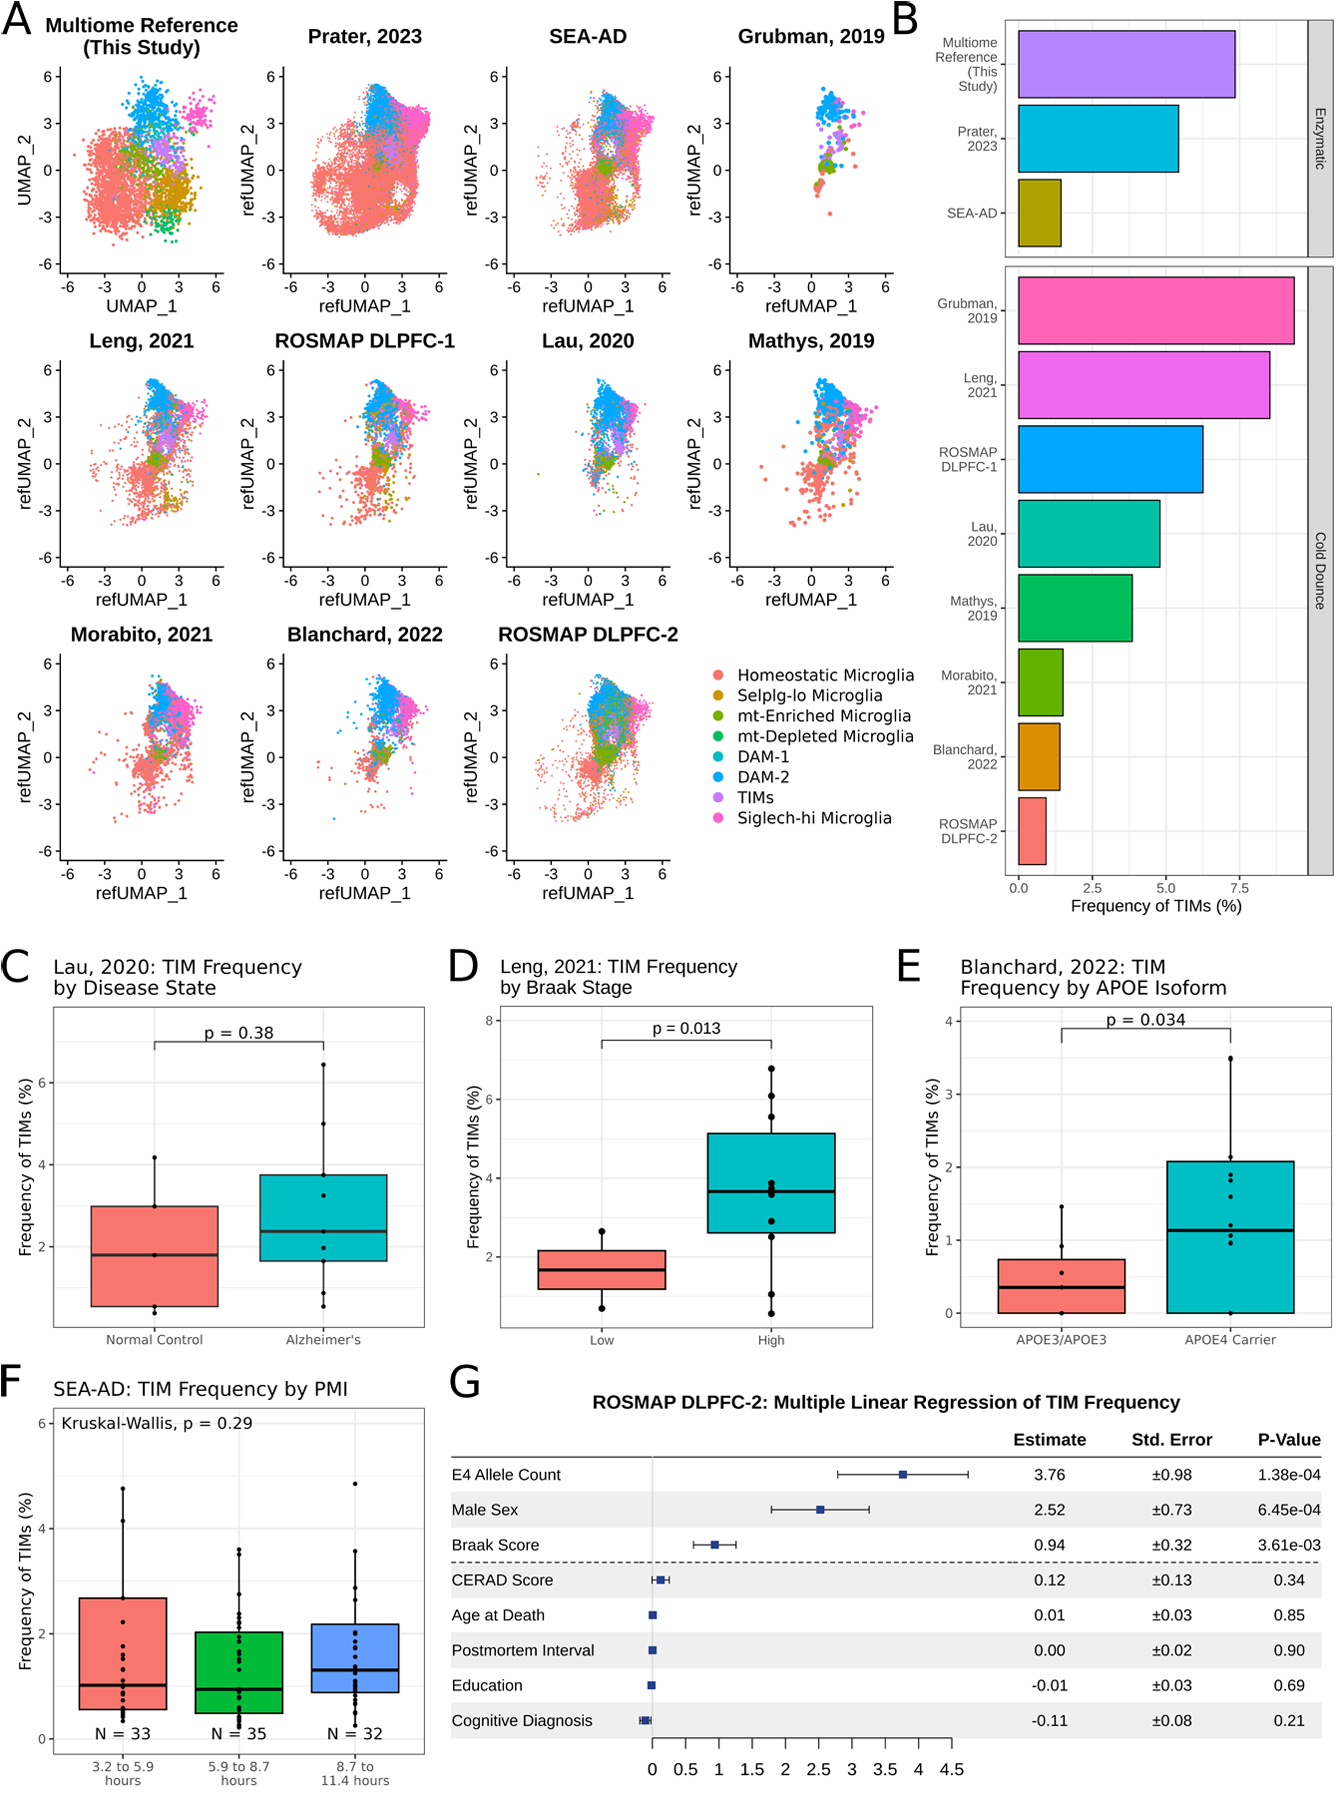
Figure 4: TIMs are detected in publicly available human snRNAseq datasets.

(A) UMAP projection of microglia from ten publicly available human snRNAseq datasets after anchor integration onto the data acquired in this study. (B) Barplot of TIM frequency in each dataset. (C) Boxplot of TIM frequency in data projected from Lau, 2020, grouped by disease state. Significance evaluated by Welch’s t-test. (D) Boxplot of TIM frequency in data projected from Leng, 2021, grouped by Braak stage, a measure of disease severity. Significance evaluated by Welch’s t-test. (E) Boxplot of TIM frequency in data projected from Blanchard, 2022, grouped by either amyloid-β burden or by presence of an APOE4 allele. Significance evaluated by Welch’s t-test. (F) Boxplot of TIM frequency in data projected from the Seattle AD Brain Atlas, grouped by post-mortem interval. Significance evaluated by Kruskal-Wallis test. (G) Multiple linear regression of TIM frequency by metadata provided in the second ROSMAP dorsolateral prefrontal cortex (n = 465).
