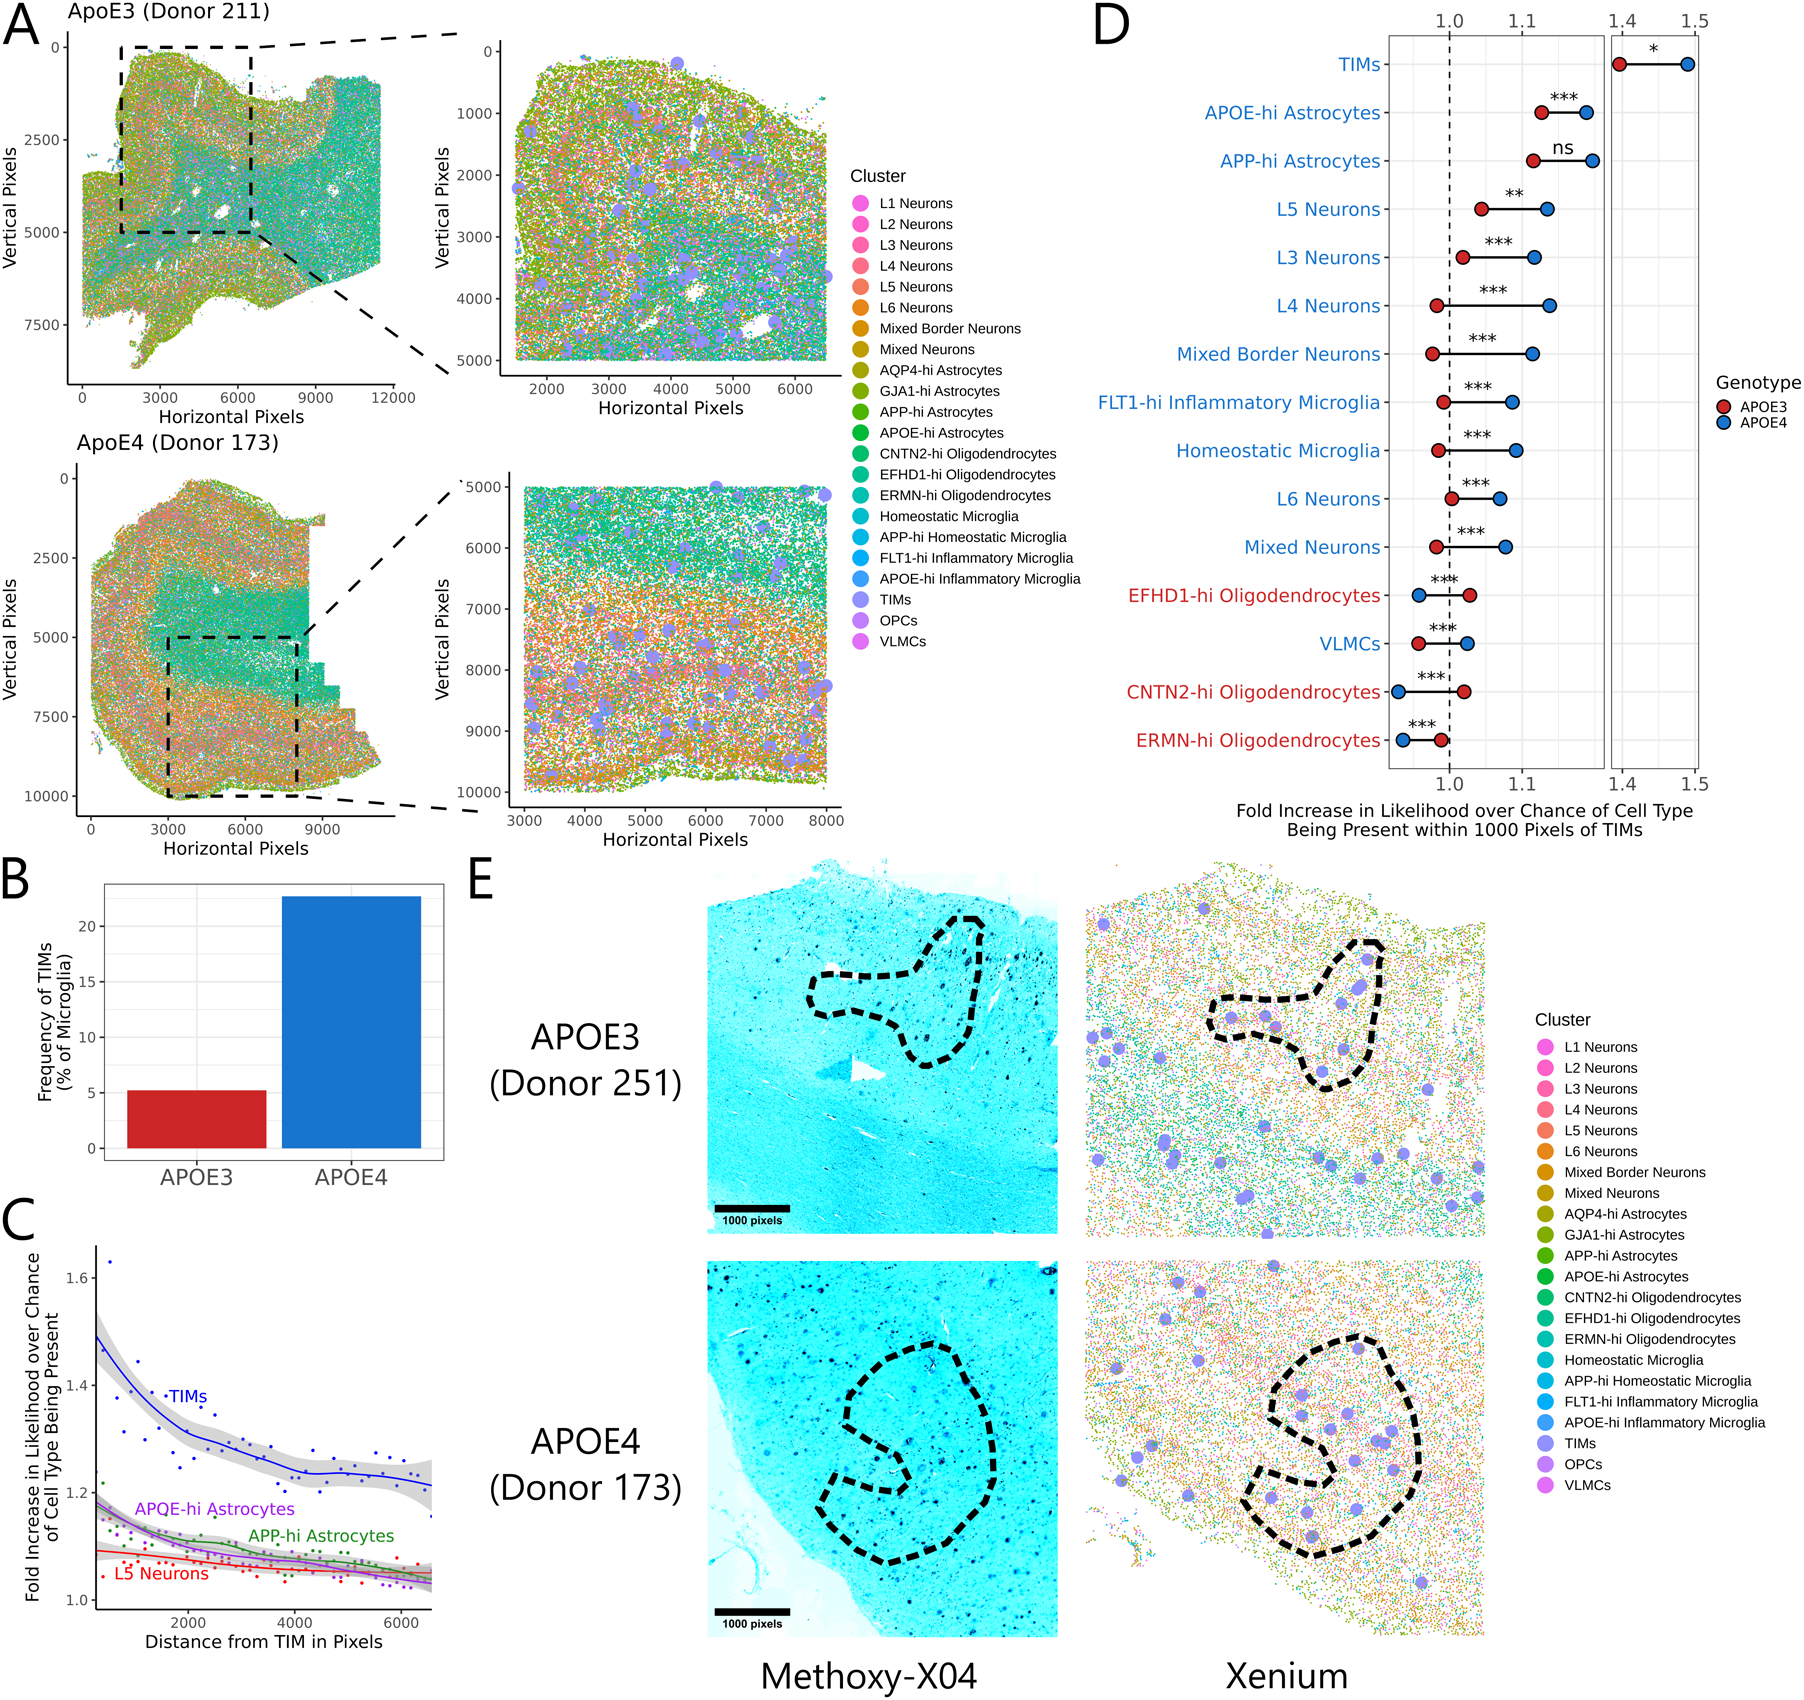
Figure 5: TIMs are enriched in the cortical layers of human AD patients bearing ApoE4.

(A) Spatial scatter plot of cell annotations in two representative sections out of the six subjected to Xenium analysis. At left is the full section, at right is a zoomed inset of the indicated region. TIMs are marked by larger point sizes in the zoomed inset for clarity. (B) Barplot of the fraction of microglia from each genotype annotated as a TIM. (C) Smoothed trendlines of the increased likelihood of finding a given cell type within a circle of the indicated radius centered on a TIM compared to over base expectation. Only the top four most enriched clusters are shown. (D) Barbell plot showing the increased likelihood of finding a given cell type within a circle of the indicated radius centered on a TIM compared to base expectation, separated by genotype. Significance evaluated by Welch’s t-test. Clusters are colored by which genotype shows higher enrichment around TIMs. (E) Representative fluorescence micrographs of cortical tissue sections from APOE3 and APOE4 donors after post-Xenium staining with methoxy-X04 (a stain for Aβ) and accompanying annotations from Xenium data. TIMs are marked by larger point sizes in the Xenium annotations for clarity. Circled regions indicate areas of high overlap between TIMs and Aβ plaques.
