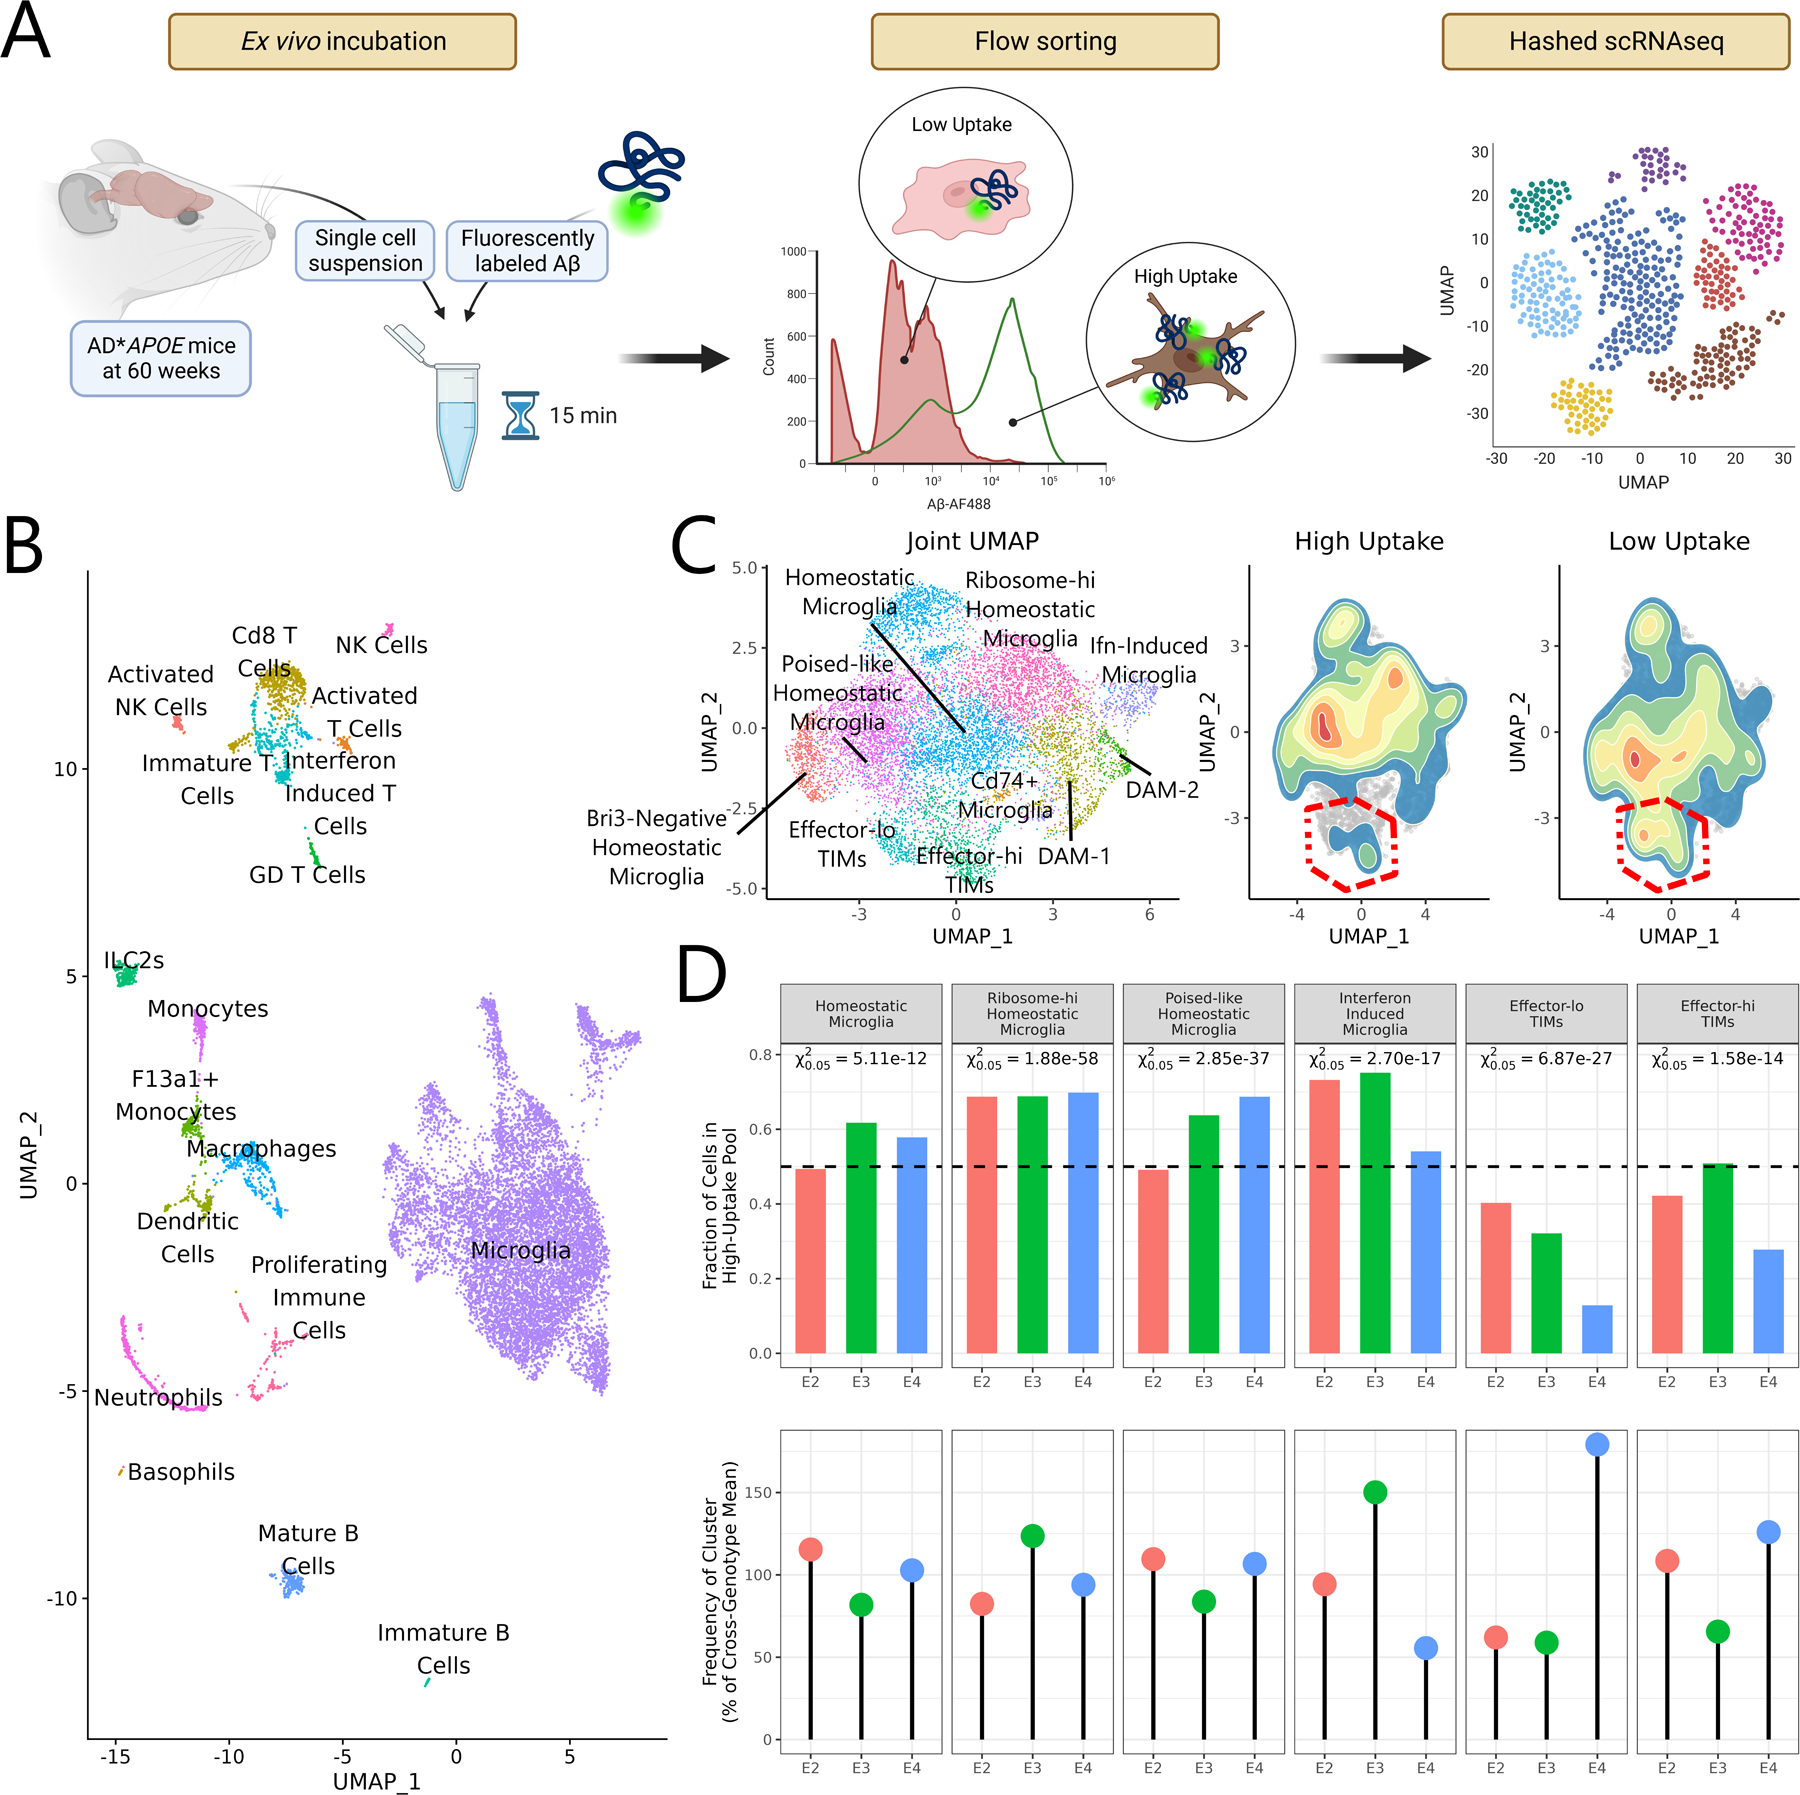
Figure 6: TIMs are functionally impaired in capacity for amyloid-β clearance.

(A) Schematic of the experimental strategy to characterize microglial capacity for ex vivo Aβ uptake. (B) UMAP generated from all cells sequenced after the Aβ uptake experiment. (C) Joint subclustering UMAP of all microglial cells in the dataset and 2D density plots overlaid on the microglial UMAP showing cell distributions from the high uptake and low uptake populations. TIM clusters are outlined in red. Note that TIMs, and particularly effector-lo TIMs, are depleted in the high uptake fraction. (D) Barplot of the fraction of cells from each genotype and cluster in the high uptake pool and dotplot showing the fraction of cells from each genotype in the given cluster. Degree of over- or underrepresentation in the high uptake pool was evaluated using a chi-square test on the null expectation of an even split. P-values are reported at the α = 0.05 threshold.
