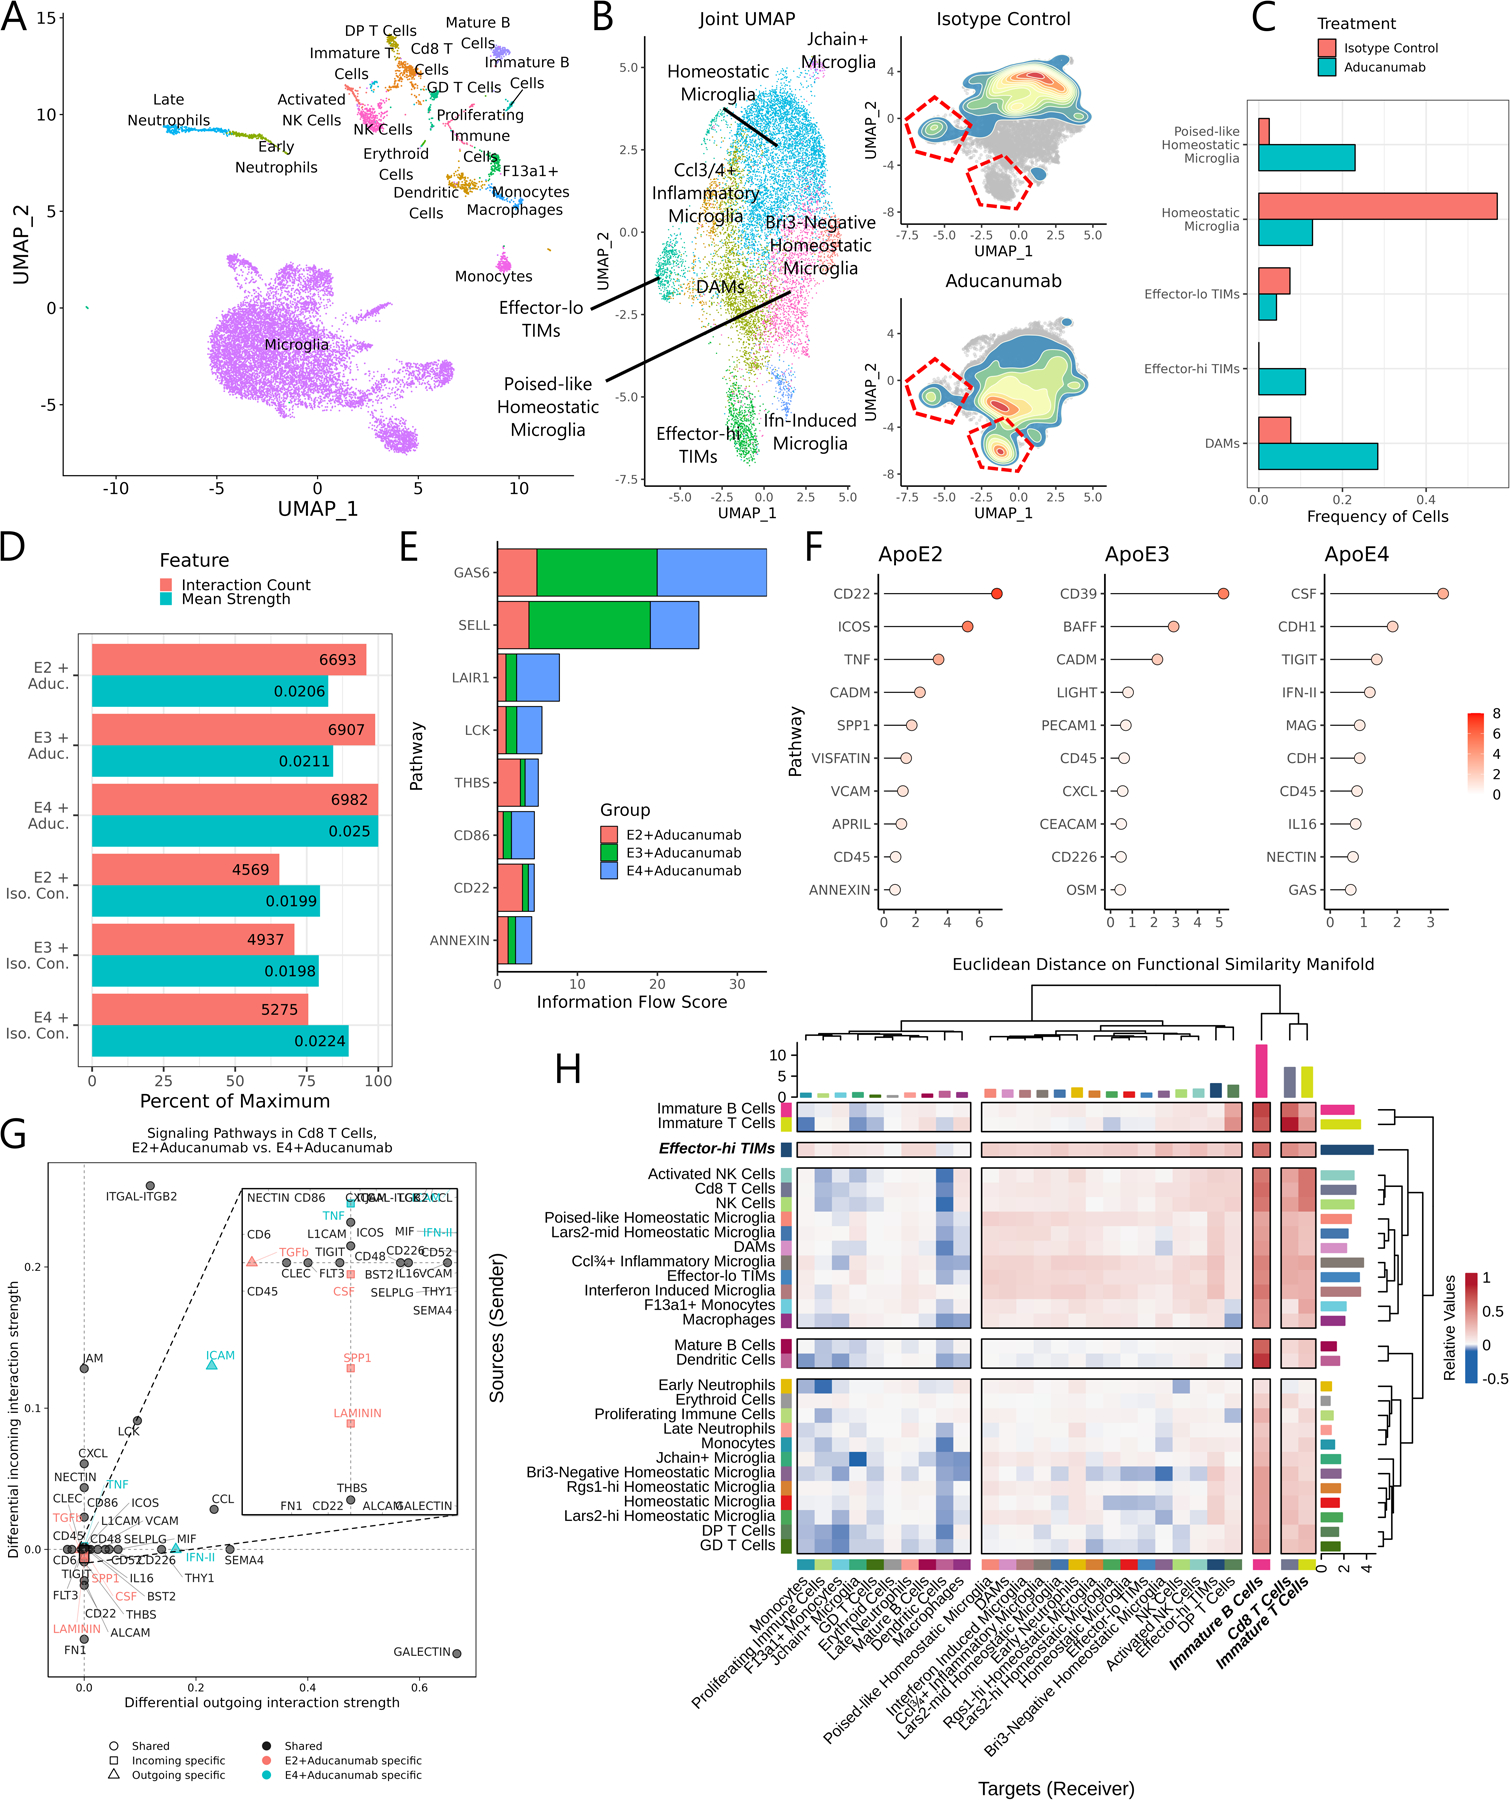
Figure 7: Aducanumab treatment profoundly alters the landscape of immune cells in the AD milieu.

(A) UMAP of all cells from the unified aducanumab dataset. (B) Joint subclustering UMAP of all microglial cells in the dataset and 2D density plots overlaid on the microglial UMAP showing cell distributions from the aducanumab-treated and isotype control-treated populations. TIM clusters are outlined in red. (C) Barplot of the frequency of microglial clusters in aducanumab-treated and isotype control-treated populations. (D) Barplot of the number of predicted interactions and the mean predicted interaction strength from each of the six samples in the aducanumab dataset, as estimated by CellChat. (E) Stacked barplot showing the total information flow predicted by CellChat through each signaling pathway. (F) Lollipop plot showing pathways with highest differential regulation between aducanumab-treated and isotype control-treated samples in each genotype, quantified by Euclidean distance on the joint functional similarity manifold produced by CellChat embedding. (G) Dotplot of differentially enriched signaling pathways in Cd8 T cells between AD*APOE2 and AD*APOE4 aducanumab-treated animals by both incoming and outgoing signal strength. Pathways are color- and shape-coded by directionality and sample specificity. Positive numbers indicate a greater strength in AD*APOE4. (H) Heatmap showing the mean difference in incoming and outgoing signaling between aducanumab-treated and isotype control-treated animals. Positive numbers indicate a greater strength in aducanumab-treated animals. Note that the strongest increases in outgoing signaling are in inflammatory microglia and especially in effector-hi TIMs.
