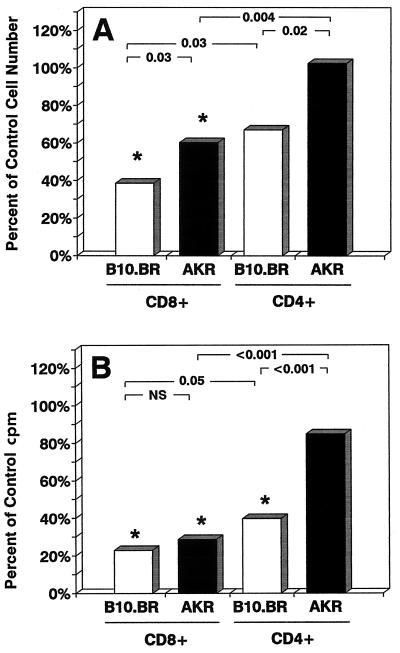
FIG. 3.
There are qualitative and quantitative differences in the effects of rLTB on CD4 and CD8 T-cell subsets from high- and low-sensitivity strains. (A) T-cell-enriched cell suspensions (B220 negative) from B10.BR and AKR spleens were treated with 10 μg of rLTB per ml for 2 h on ice, washed, and then incubated at 37°C for 24 h. The numbers of viable CD4 and CD8 T cells at 24 h were measured in SCDA assays. Data are normalized to the numbers of cells present in untreated control wells (AKR CD4, 53,171 ± 3,778; AKR CD8, 23,363 ± 1,750; B10.BR CD4, 31,271 ± 4,299; B10.BR CD8, 31,245 ± 408). ∗, P < 0.05 versus untreated control cells. P values between LTB-treated groups are shown at the top. (B) Positively selected CD4 and CD8 T cells isolated from the spleens of B10.BR and AKR mice were treated with 10 μg of rLTB per ml for 2 h on ice, washed, and then plated on anti-CD3-coated microwells for 72 h. Cell proliferation was measured by [3H]TdR uptake during the last 20 h of culture in triplicate microwells. Data are expressed as percentages of counts per minute in untreated control wells (AKR CD4, 50,578 ± 9,882; AKR CD8, 27,537 ± 8,452; B10.BR CD4, 91,918 ± 13,167; B10.BR CD8, 29,430 ± 5,384). Statistical comparisons are as described for panel A. NS, not significant.

