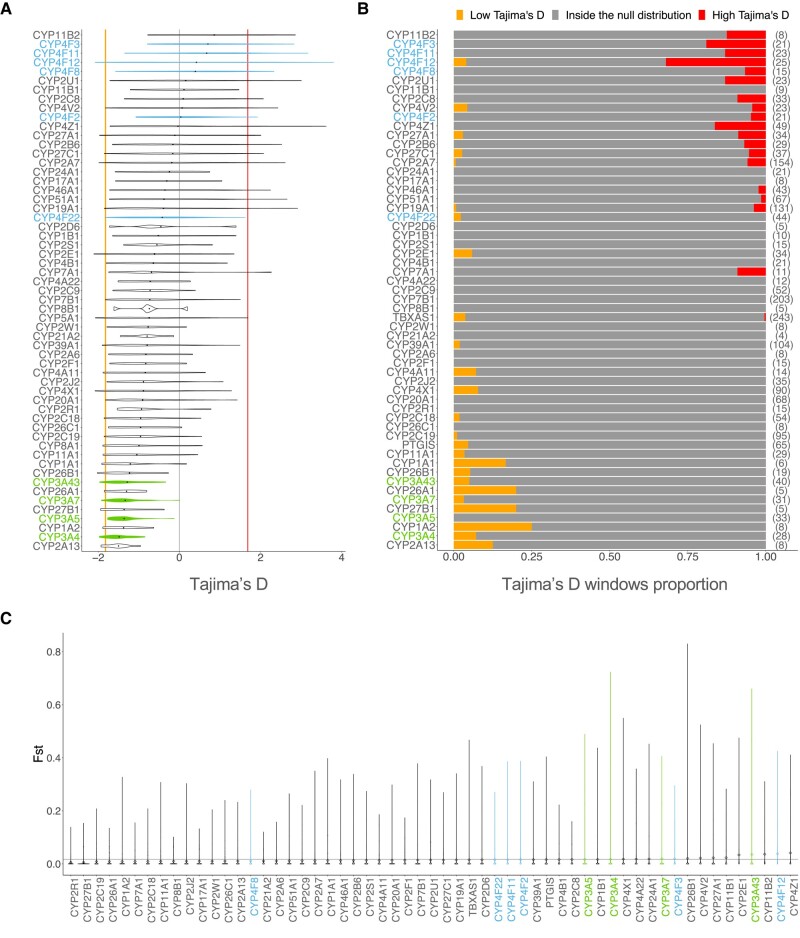
Fig. 1.
Metrics of diversity and differentiation among CYP genes. a) Distribution of Tajima’s D values computed on windows of 1 Kb for each CYP450 genes in the European populations. The 2.5th percentile is marked by the orange vertical line on the left, and the 97.5th percentile is marked by the red vertical line on the right, representing the significance threshold. b) Proportion of Tajima’s D windows lying outside the null distribution for each CYP450 gene. For each gene, the total number of windows of Tajima’s D is shown beside the proportions, between brackets. The windows with Tajima’s D values below the 2.5th percentile is displayed in orange on the left side of the plot and over the 97.5th percentile is displayed in red on the right side of the plot. c) Distribution of values for each CYP450 gene calculated on 4 super-populations (AFR, EUR, EAS, and SAS). The mean of chromosome 22, the null distribution, is displayed with the gray horizontal line.

