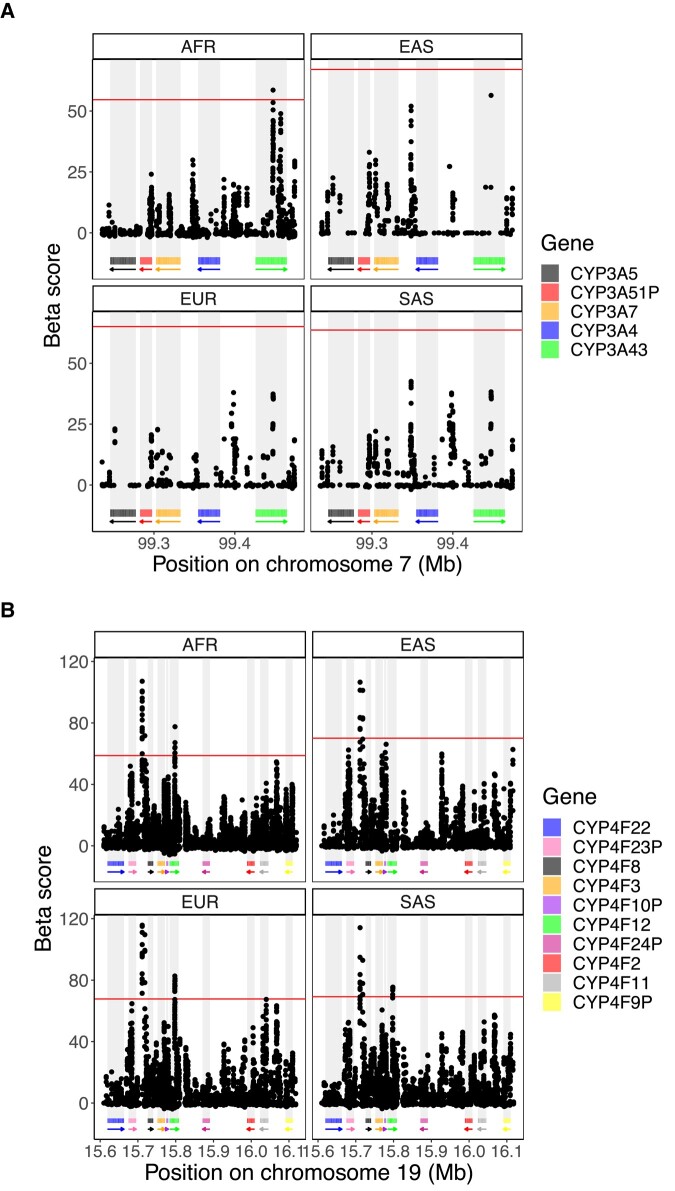
Fig. 3.
β score in the chromosomal region of the a) CYP3A and b) CYP4F cluster for the four super-populations analyzed. The β score was calculated on the 1000G dataset and the 99th percentile indicating the top 1% β score is displayed by the horizontal line in red. Rectangles below the plot show the position of each gene, and arrows indicate on which strand the gene is located.

