
Fig. 4.
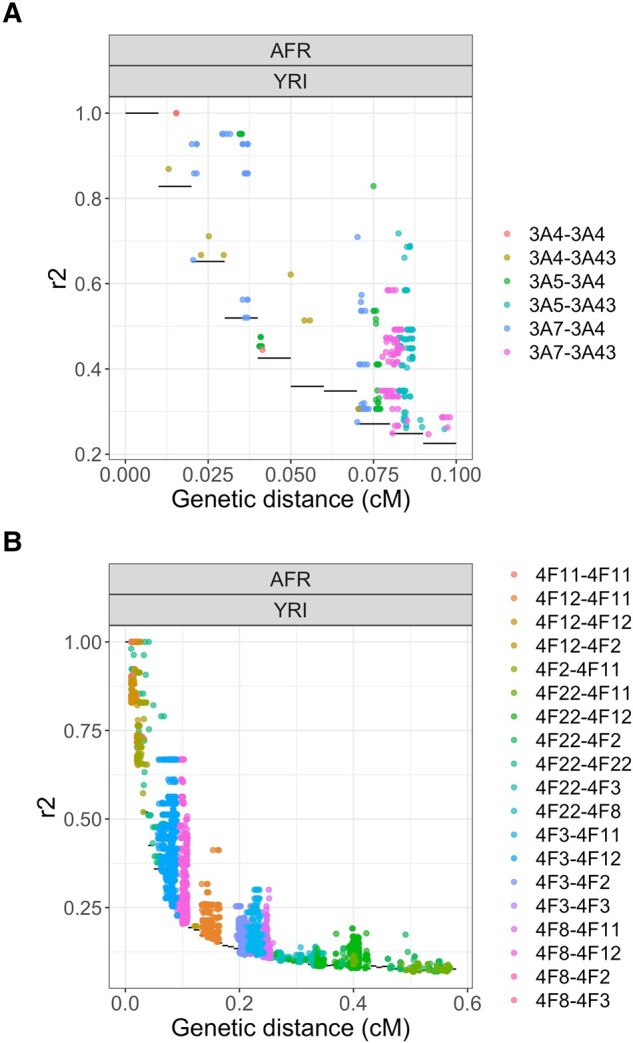
values between each pairs of SNPs in the a) CYP3A and b) CYP4F cluster in the Yoruba (YRI, AFR) population. The distance between the SNPs is in centimorgan (cM). Only values over the null distribution are shown. The null distribution is shown with black horizontal lines. Dots are colored according to which genes are involved in the pair.