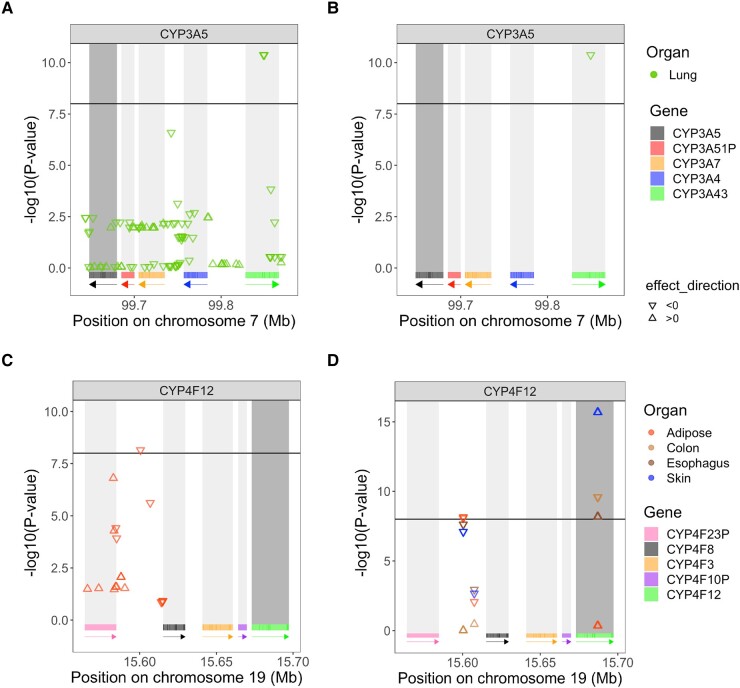
Fig. 5.
P-values of the associations between SNPs under a) positive selection and b) balancing selection and CYP3A5’s gene expression in lung and P-values associated with SNPs c) under positive selection and d) balancing selection and tissue-specific gene expression of CYP4F12. CYP3A5 and CYP4F12 are shown in dark gray, as the expressions of these genes are tested. The triangle standing on its base indicates a positive effect size (), while a triangle standing on its point indicates a negative effect size (). The threshold, set to , is represented by the horizontal black line, meaning that a is a significant eQTL. Only tissues with significant eQTLS are displayed. As before, rectangles below each plot show the position of each gene, and arrows indicate on which strand the gene is located. Each gene has its own color to indicate its location.

