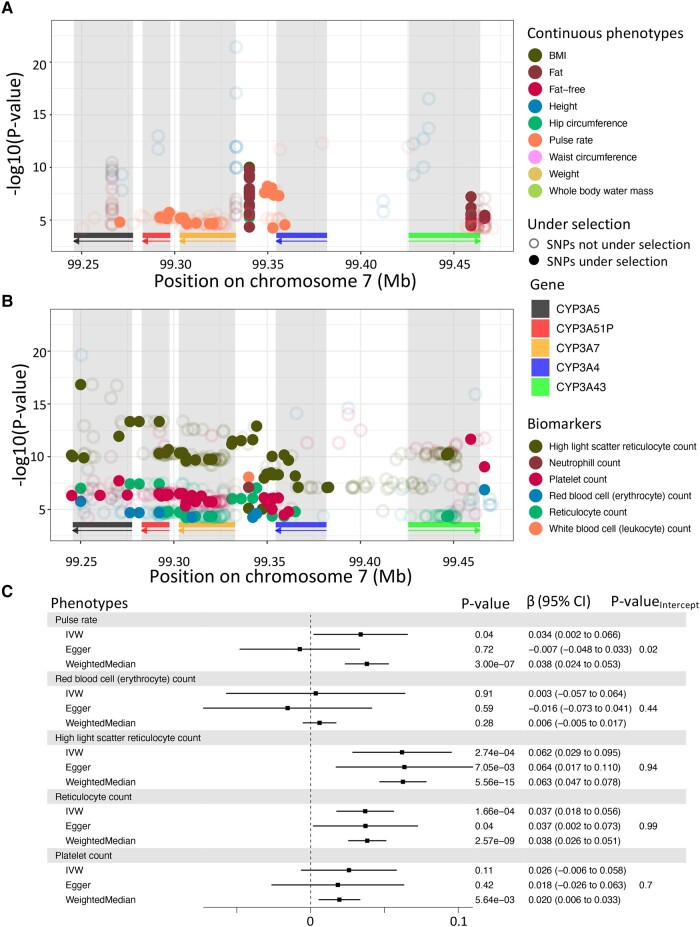
Fig. 6.
Associations of CYP3A cluster with phenotypes in the UK biobank. Significant associations () for continuous traits a) and plasmatic biomarkers b) which are significant in at least one SNP under selection. SNPs under selection are represented as full dots, meanwhile other SNPs are represented as empty dots. As before, rectangles below each plot show the position of each gene, and arrows indicate on which strand the gene is located. Each gene has its own color to indicate its location. c) Causal relationship with CYP3A5 expression in lung for phenotypes showing significant association with its eQTLs. β represents the change of 1 standard deviation of CYP3A5 expressions on phenotypes, also in standard deviation units. P-value of three statistics (IVW, Egger, Weighted Median) are displayed with the β and the 95% confidence interval (CI) of the association for each phenotype in the gray box. For Egger, the P-value of the intercept is also displayed.

