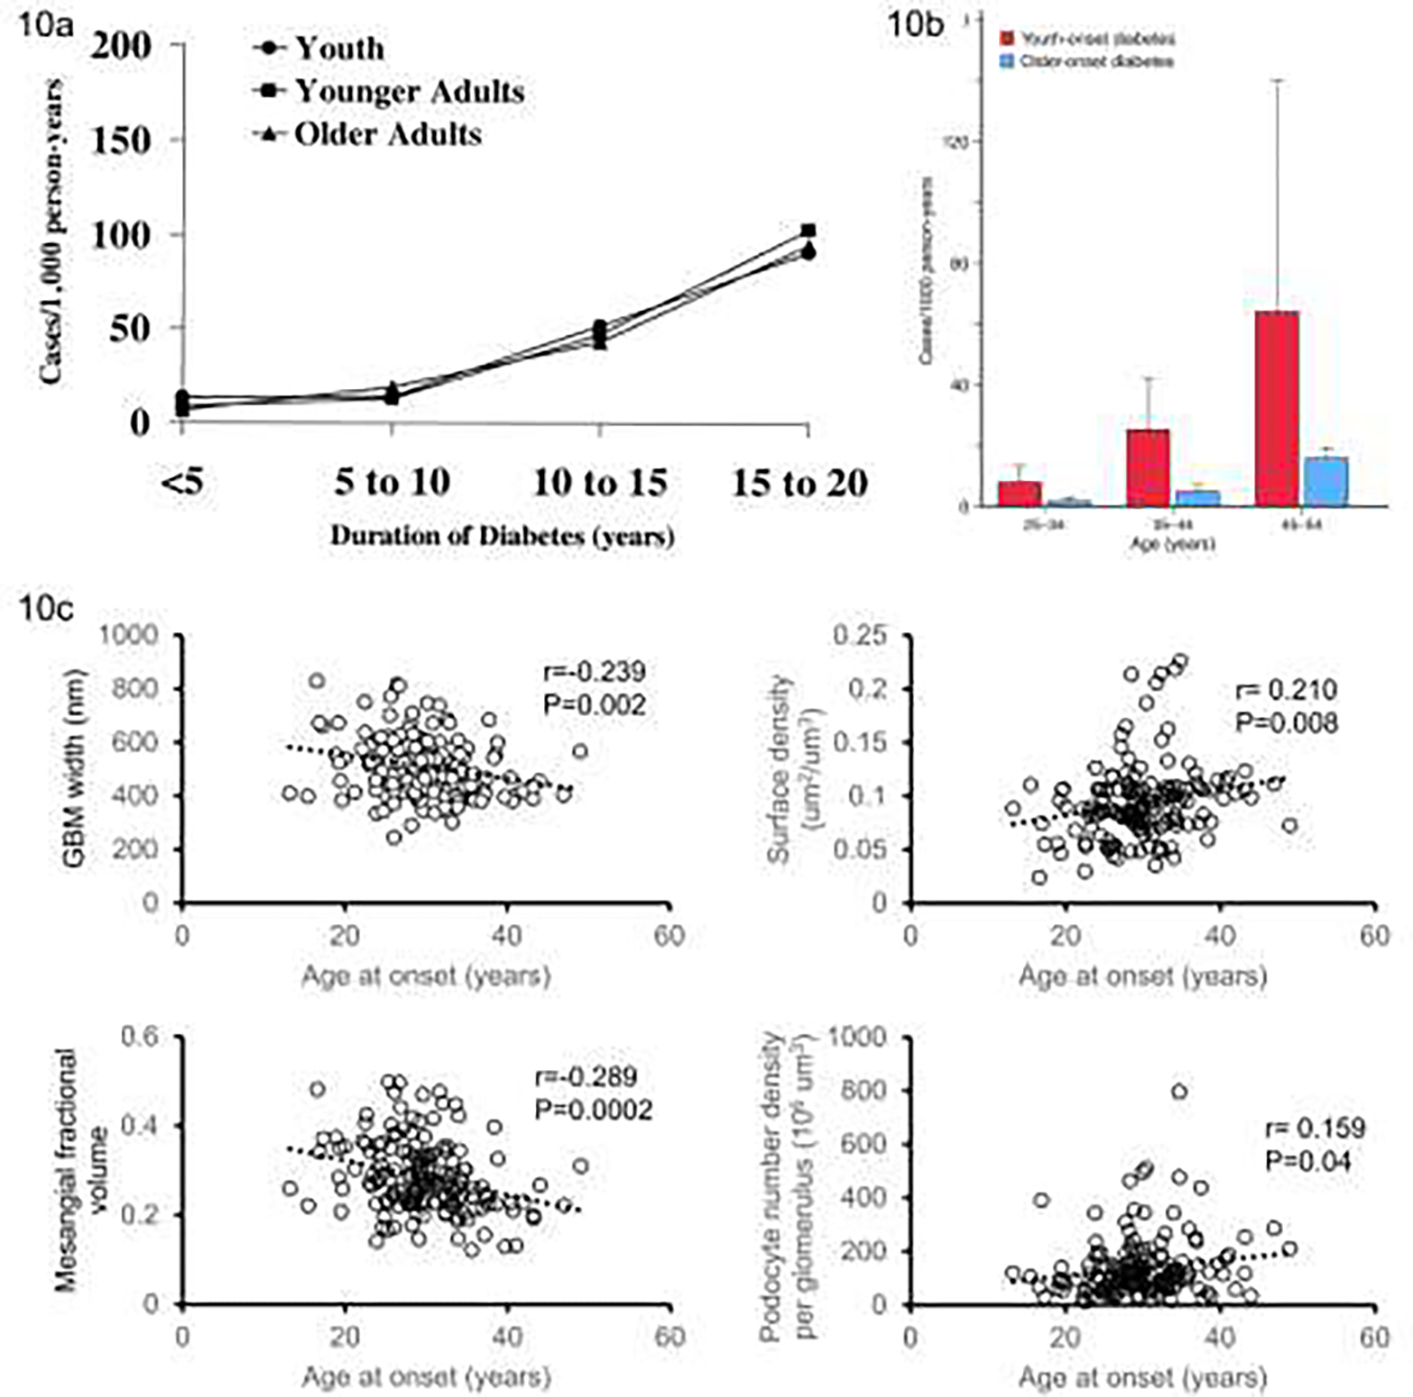
FIGURE 10:

a) Incidence of proteinuria (urine protein-to-creatinine ratio ≥0.5 g/g) by age of onset of diabetes black circles – diabetes diagnosed age <20 years, black squares – diabetes diagnosed age 20–39 years, black triangles – diabetes diagnosed age 40–59 years. Test for trend, P = 0.77, calculated using Mantel-Haenzel test to compare incidence rates between age groups, controlling for diabetes duration (From Krakoff et al, 2003 85); b) Sex adjusted incidence rates of kidney failure by age of onset for Pima Indians aged between 25 and 54 years – red bars for youth-onset type 2 diabetes (age of onset under 20 years) and blue bars older-onset type 2 diabetes (age of onset over 20 years) (Adapted from Pavkov et al 86); c) Association of selected kidney structure measures with age at onset of diabetes. Plots show correlation of residuals for each structural measure and age at onset of diabetes adjusted for attained age, sex, HbA1c, BMI, and GFR (From Looker et al, 202287).
