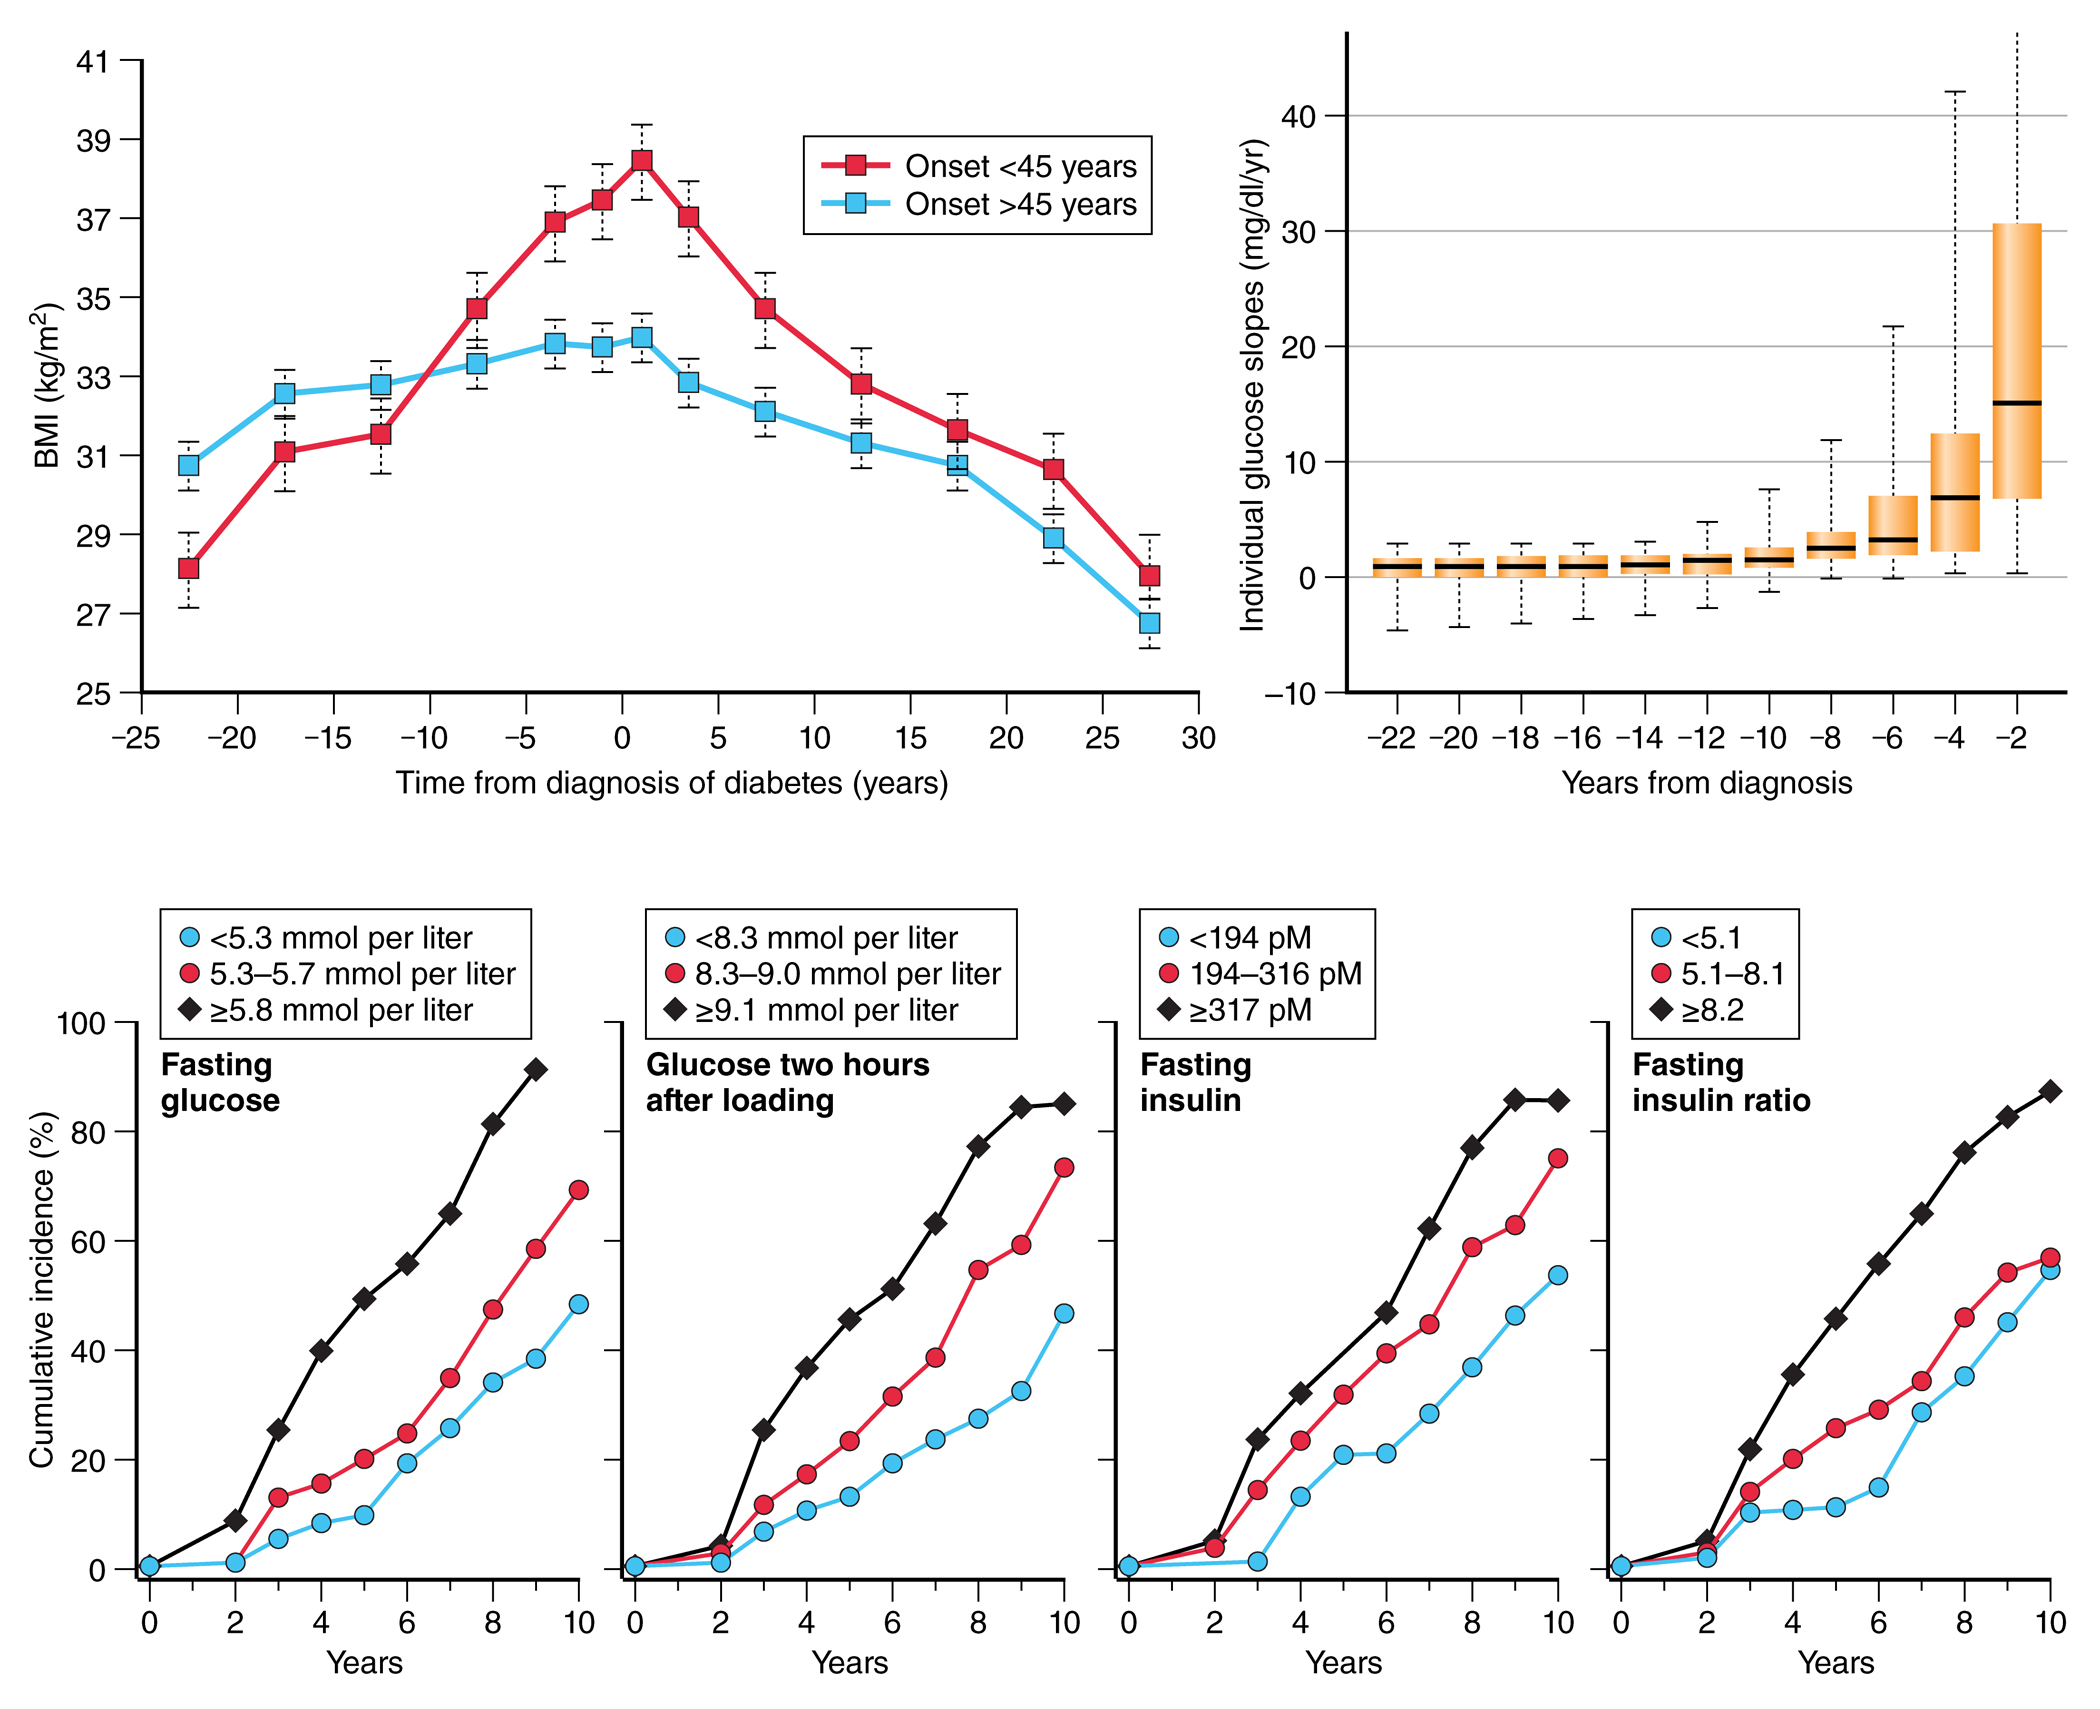
FIGURE 2:

a) Change in body mass index in Pima Indian adults before and after diagnosis of diabetes. Each point represents the mean +/− standard error for each 5-year duration band, divided by age of onset of diabetes (Adapted from Looker et al, 2001 29); b) Distribution of instantaneous glucose slopes (rates of change of glucose in individuals) in 55 Pima Indians by time from diabetes diagnosis. Data are medians with 25th and 75th percentiles with ranges shown by error bars (Adapted from Mason et al, 2007 30); c) cumulative incidence of diabetes based on tertiles of fasting glucose, 2-hour glucose, fasting insulin, and 2-hour insulin showing highest cumulative incidence of diabetes in the highest tertile of each measure (Adapted from Saad et al 1988 31). NOTE: Figure 2b uses non-SI units.
