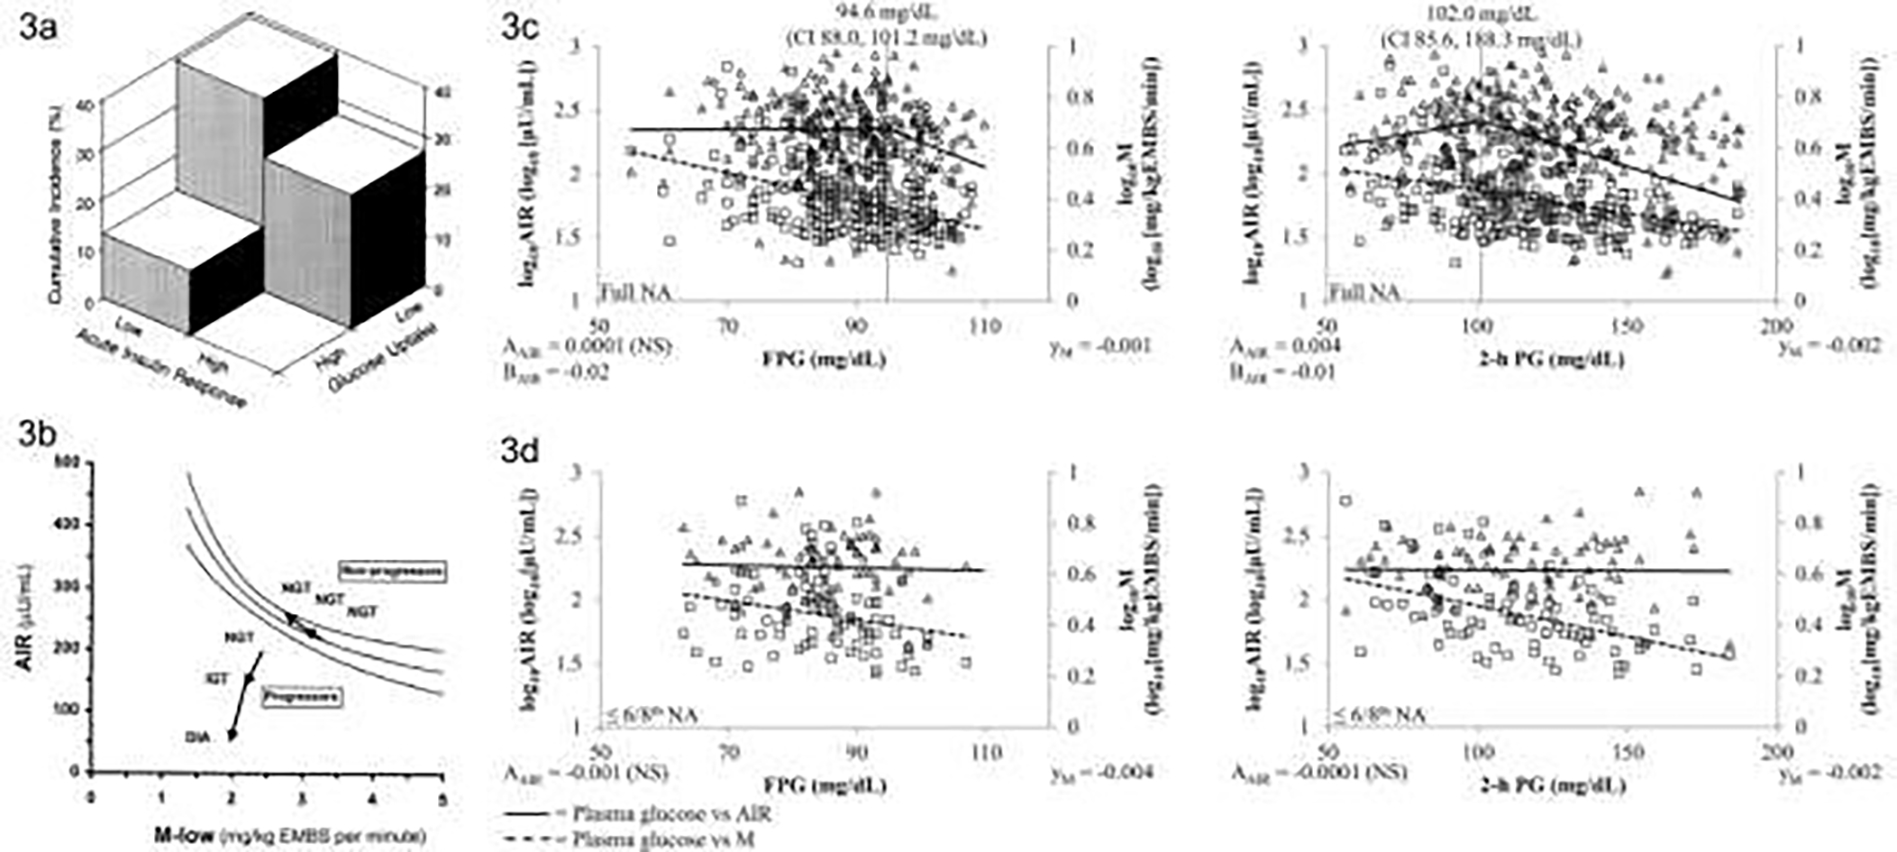
FIGURE 3:

a) Cumulative incidence of diabetes according to whether measures of acute insulin response and glucose uptake fall below or above the median – the highest cumulative incidence is seen in the participants with below median values of both measures (From Lillioja et al, 19939); b) Disposition index for participants with NGT compared to participants who progressed from NGT to IGT and then diabetes – shows the relationship in the progressors does not fall on the normal hyperbolic curve even when still NGT and continues to move away from the curve as glycemia worsens (From Weyer et al, 199910); c) Acute insulin response (AIR) of full heritage Pima Indians and; d) those with ≤3/4th Pima heritage relative to increasing fasting (FPG) and 2-h plasma glucose (2-h PG) concentrations. Triangles mark the relationship of AIR and plasma glucose concentrations, whereas squares stand for the relationship between the rate of insulin-dependent glucose disposal (M) and plasma glucose concentrations. For plasma glucose concentration vs. AIR, AAIR gives the slope up to the plasma glucose concentration of the inflexion point. BAIR indicates the slope for this relationship beyond that point. The inflexion point is marked by a vertical line and its respective plasma glucose concentration with 95% confidence interval (CI) is reported. Where no inflexion point was found, AAIR gives the overall slope. In each panel, development of AIR relative to plasma glucose concentrations is indicated by a line. The trendline for plasma glucose concentrations vs. M is indicated by a dashed line, and its slope is reported (yM). Slopes and trendlines for plasma glucose concentrations vs. AIR and M, respectively, were tested for statistical significance (NS, not significant). Values for AIR and M were log10-transformed to meet linear distribution. Abbreviations: AIR, acute insulin response; DIA, type 2 diabetes; EMBS, estimated metabolic body size; IGT, impaired glucose tolerance; NA, Native Americans; NGT, normal glucose tolerance. (From Heinitz et al, 2018 36) NOTE: Figures 3c and 3d use non-SI units.
