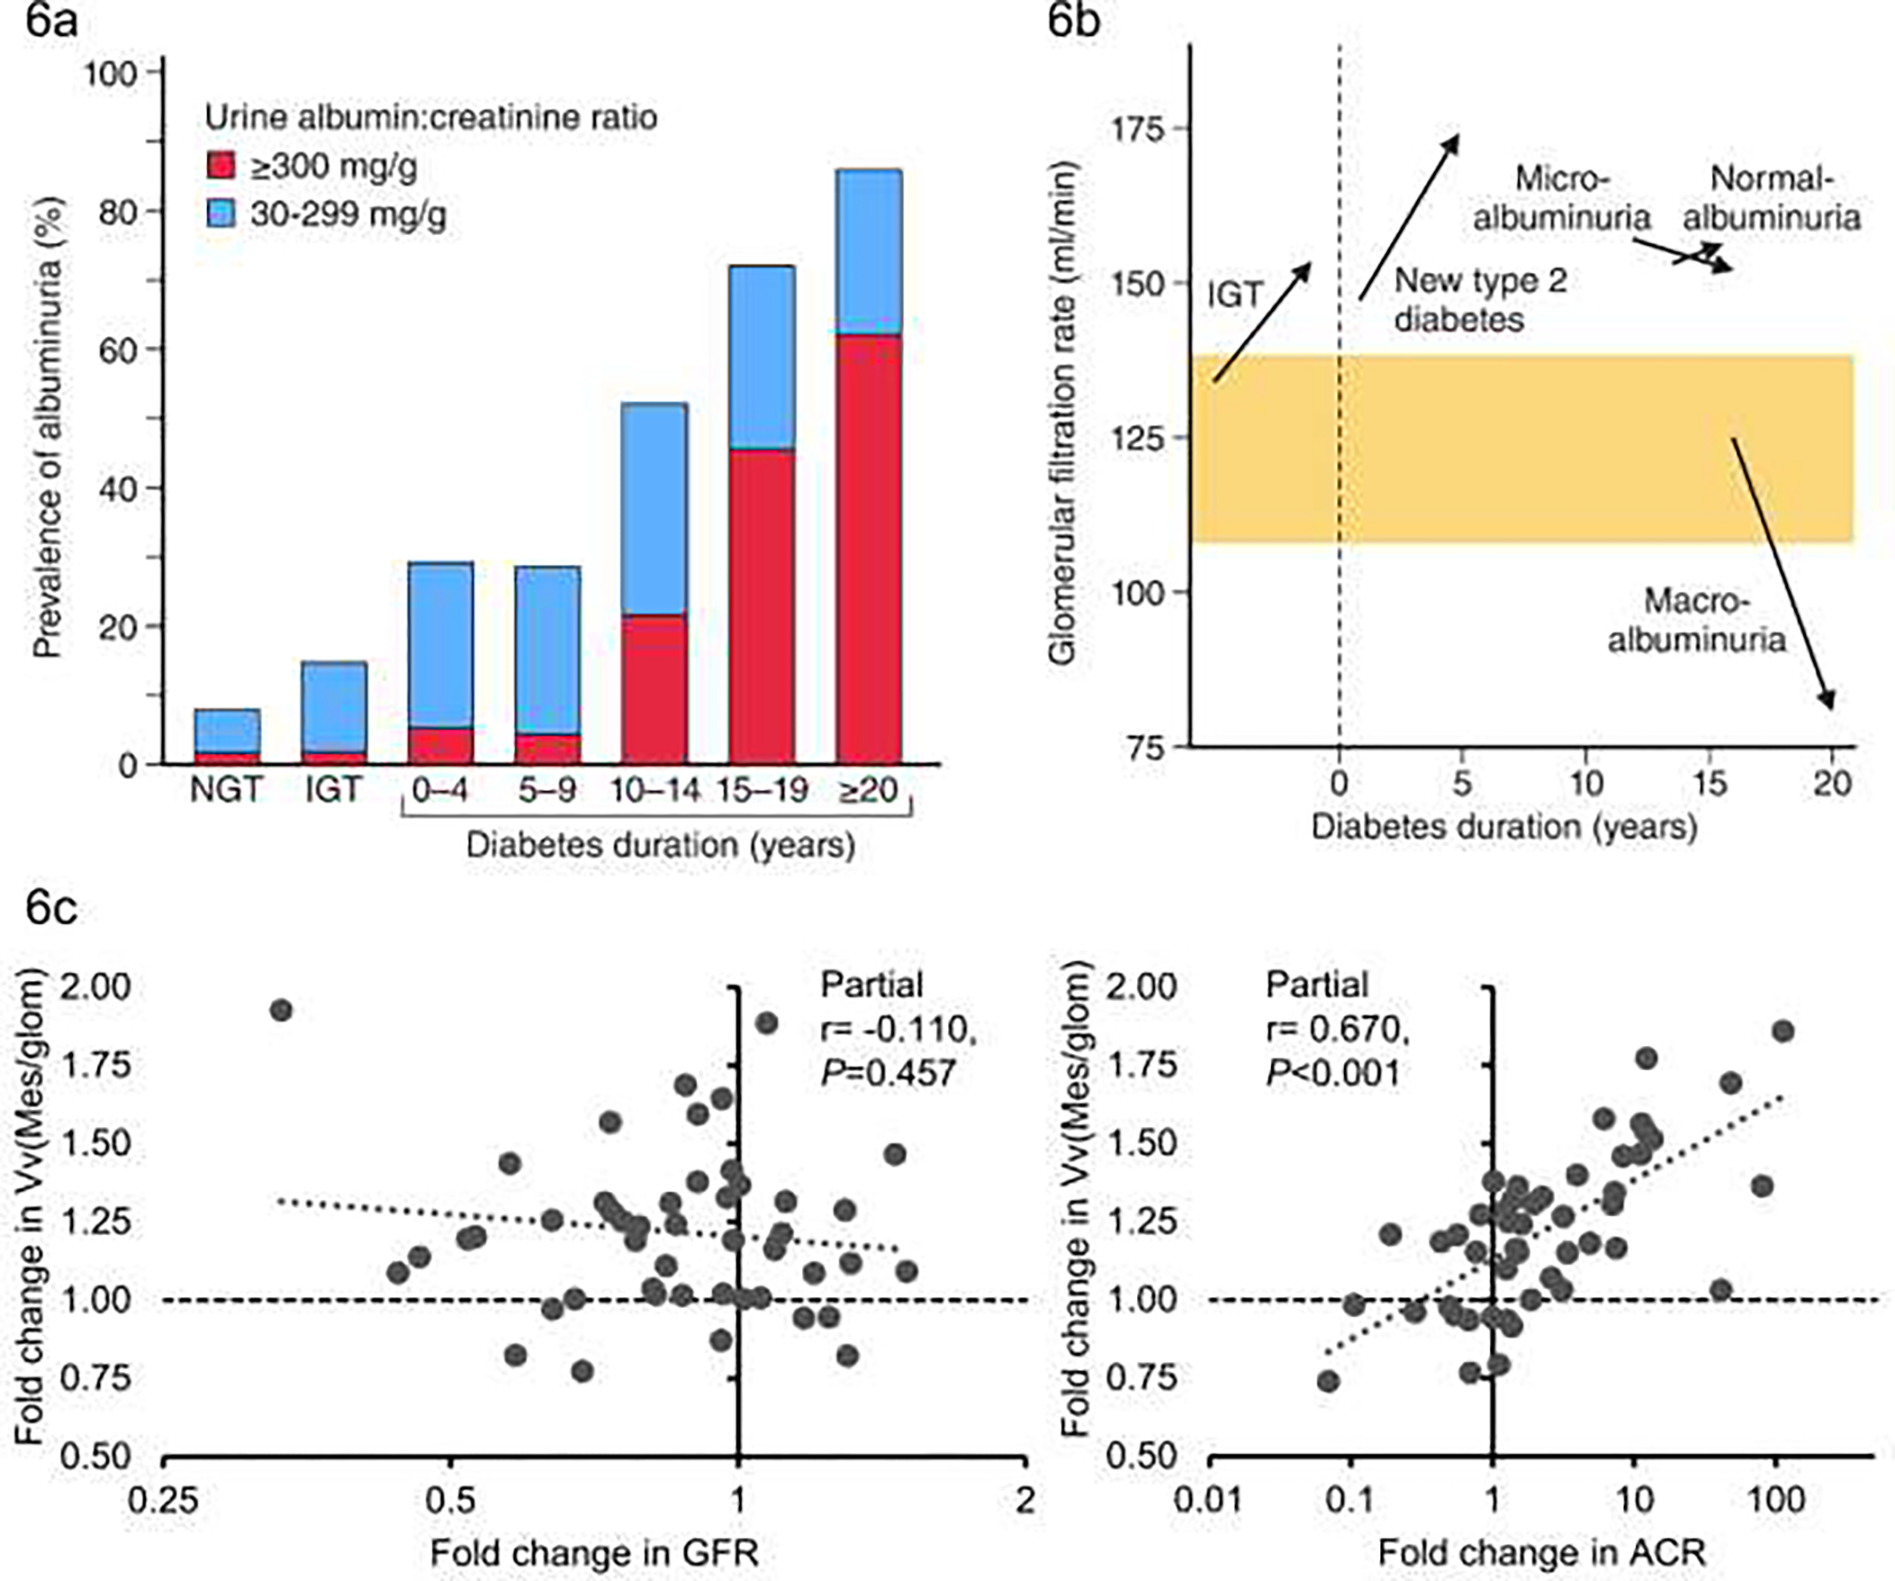
FIGURE 6:

a) Prevalence of albuminuria by glycemia and diabetes duration (blue bars for ACR 30–299 mg/dl), red bars for ACR >= 300 mg/dl) NGT = normal glucose tolerance, IGT = impaired glucose tolerance (Adapted from Nelson et al 198996); b) Changes in mean glomerular filtration rate by glycemia stage, diabetes duration and degree of albuminuria - normoalbuminuria = ACR <30 mg/dl micro-albuminuria = ACR 30–299 mg/dl, also known as moderate albuminuria; macroalbuminuria = ACR >= 300 mg/dl) also known as severe albuminuria (Adapted from Nelson et al, 199611); c) Association of fold change in fractional mesangial volume with fold change in ACR (right panel) and fold change in GFR (left panel) partial correlation coefficients are adjusted for age, sex and baseline values of ACR and GFR respectively (Adapted from Looker et al, 201975).
