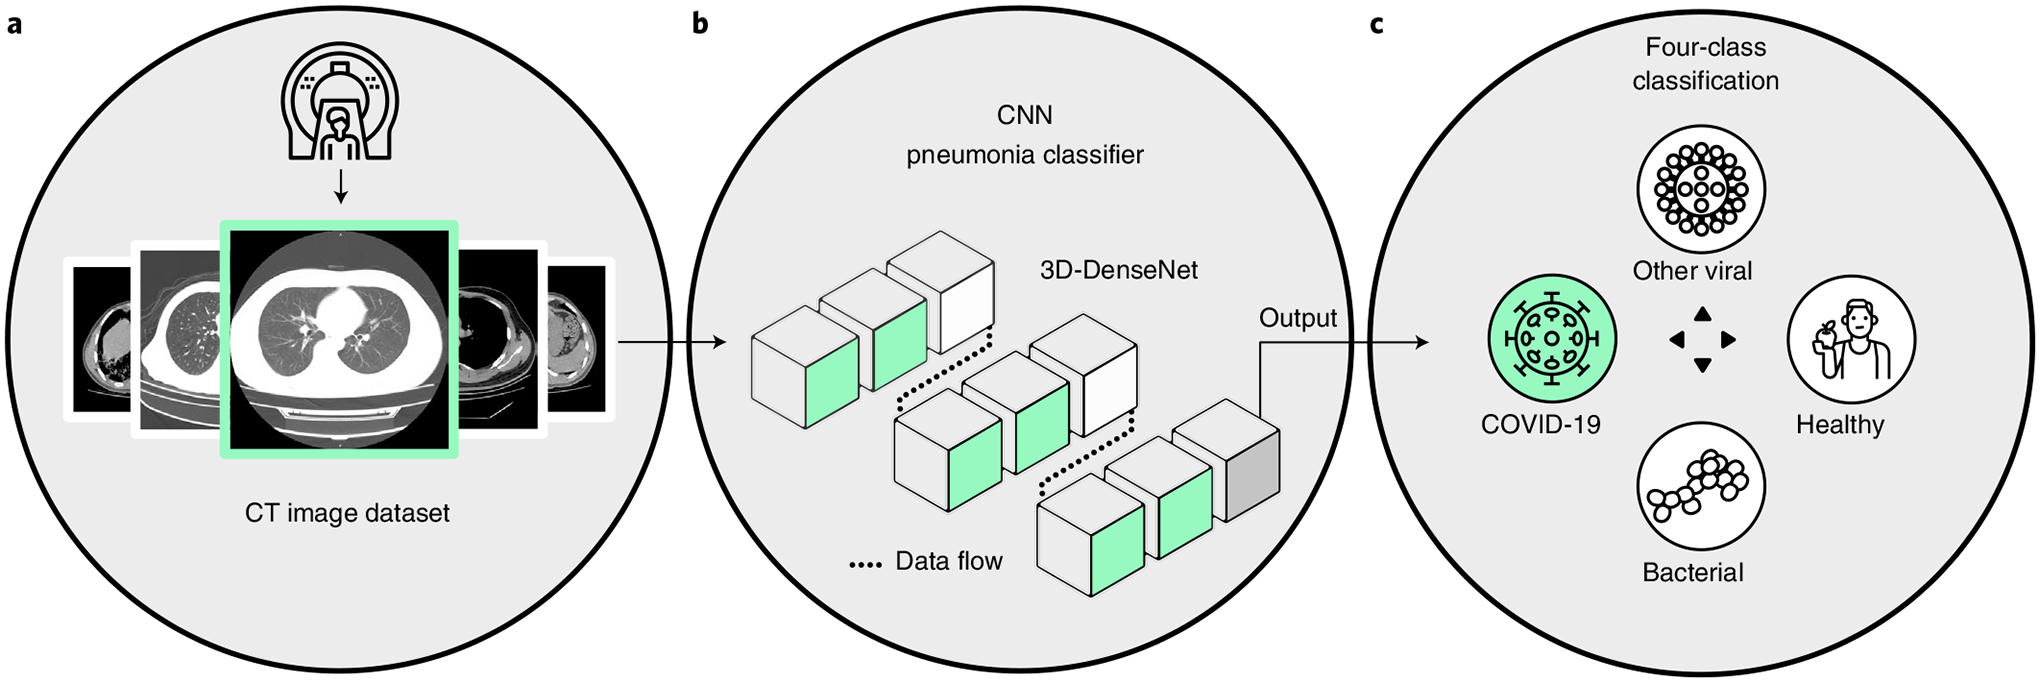
Fig. 2 |. Deployment and workflow of UCADI participants.

a, Data: construct a local dataset based on the high-quality, well-annotated and anonymized CTs. b, Flow: the backbone of the 3D-DenseNet model mainly consists of six three-dimensional dense blocks (in green), two three-dimensional transmit blocks (in white) and an output layer (in grey). Computed tomography scans of each case are converted into a (16,128,128) tensor after adaptive sampling, decentralization and trilinear interpolation, and then fed into the three-dimensional CNN model for pneumonia classification. c, Process: during training, the model outputs are used to calculate the weighted cross-entropy to update the network parameters. While testing, five independent predictions of each case are incorporated to report the predictive diagnostic results.
