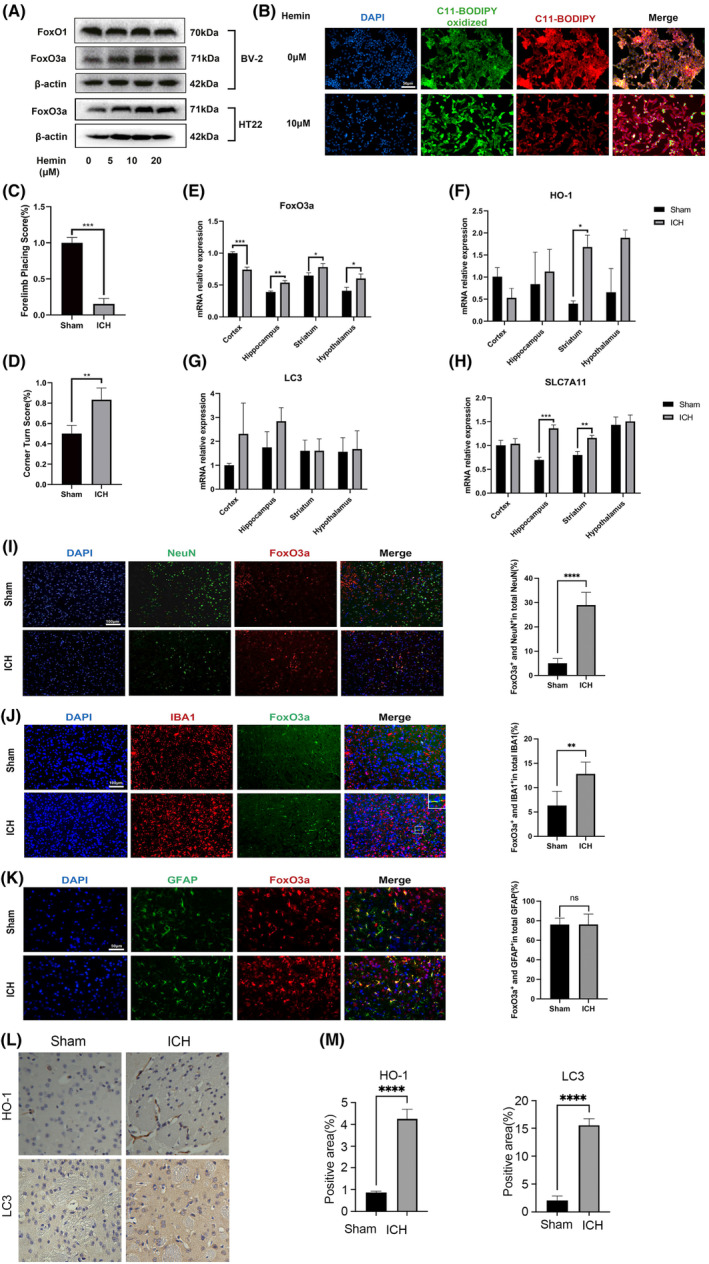
FIGURE 1.

The expression of FoxO3a is increased after treatment with hemin in vitro and in an ICH mice model. (A) HT22 cells and BV‐2 cells were treated with different concentrations of hemin, and the expressions of FoxO1/FoxO3a were determined by western blot (B) The lipid peroxidation was detected by C11 BODIPY 581/591 probe in HT22 cells after stimulated with 20 μM hemin for 24 h. (C) The forelimb placing test and (D) corner turn test of the mice in ICH model by injection of autologous whole blood (n = 5). (D) Representative immunofluorescence images of FoxO3a expression in the striatal region caused by ICH. (E–H) The mRNA levels of FoxO3a/HO‐1/LC3‐II/SLC7A11 in the cortex, hippocampus, striatum and hypothalamus of the mice in ICH model. (I–K) Representative images of FoxO3a expression in the striatal area visualised under microscopy. Quantification of co‐localization of NeuN, GFAP or Iba1 with FoxO3a in the striatum of mice under normal conditions or after ICH (n = 5). (L) Representative images of IHC staining for HO‐1/LC3 in the striatum of mice under normal conditions or after ICH (n = 3). (M) Graphical results showing the IHC scores for HO‐1/LC3 positive area. Data were expressed as mean ± SD. *p < 0.05, **p < 0.01, ***p < 0.001, ****p < 0.0001.
