
Figure 3.
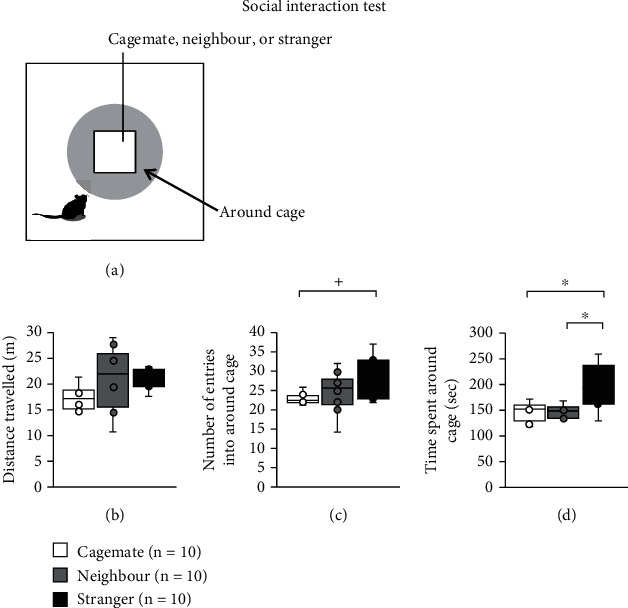
Social interaction test. (a) Schematic diagram of the social interaction test showing the position of the transparent cage and the interaction zone (around cage). Total distance travelled (b), number of entries around cage (c), and time spent around cage (d) under cagemate, neighbour, and stranger mouse conditions. All data are presented as box plots. One-way ANOVA, followed by Tukey's test, was used for statistical analysis: (b) F2,24 = 1.044; (c) F2,24 = 1.951; (d) F2,24 = 3.741. The p values were calculated using one-way ANOVA. n = 10 animals per trial. ∗p < 0.05, +p < 0.05.