. 2024 Jan 24;132(1):017004. doi: 10.1289/EHP13182

Figure 1.

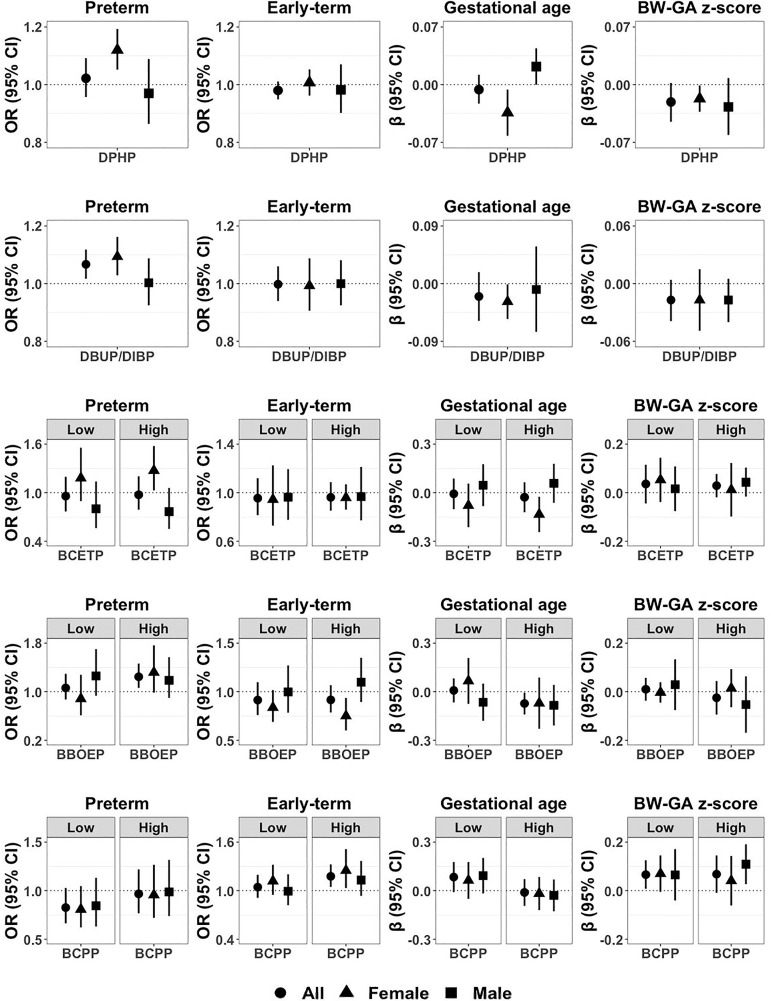
Figure 1 is a set of twenty error bar graphs. The first five graphs on the left are titled Preterm, plotting odds ratio (95 percent confidence interval), ranging from 0.8 to 1.2 in increments of 0.2; 0.8 to 1.2 in increments of 0.2; 0.4 to 1.6 in increments of 0.6; 0.2 to 1.8 in increments of 0.8; and 0.5 to 1.5 in increments of 0.5 (y-axis) across diphenyl phosphate; composite of dibutyl phosphate and di-isobutyl phosphate; low and high bis(2-chloroethyl) phosphate; low and high bis(butoxyethyl) phosphate; and low and high bis(1-chloro-2-propyl) phosphate (x-axis) for all, female, and male. The next five graphs are titled early-term, plotting odds ratio (95 percent confidence interval), ranging from 0.8 to 1.2 in increments of 0.2; 0.8 to 1.2 in increments of 0.2; 0.6 to 1.4 in increments of 0.4; 0.5 to 1.5 in increments of 0.5; and 0.4 to 1.6 in increments of 0.6 (y-axis) across diphenyl phosphate; composite of dibutyl phosphate and di-isobutyl phosphate; low and high bis(2-chloroethyl) phosphate; low and high bis(butoxyethyl) phosphate; and low and high bis(1-chloro-2-propyl) phosphate (x-axis) for all, female, and male. The next five graphs are titled gestational age, plotting lowercase beta (95 percent confidence interval), ranging from negative 0.07 to 0.07 in increments of 0.07; negative 0.09 to 0.09 in increments of 0.09; negative 0.3 to 0.3 in increments of 0.3; negative 0.3 to 0.3 in increments of 0.3; negative 0.3 to 0.3 in increments of 0.3 (y-axis) across diphenyl phosphate; composite of dibutyl phosphate and di-isobutyl phosphate; low and high bis(2-chloroethyl) phosphate; low and high bis(butoxyethyl) phosphate; and low and high bis(1-chloro-2-propyl) phosphate (x-axis) for all, female, and male. The next five graphs are titled birth weight for gestational age, plotting lowercase beta (95 percent confidence interval), ranging from negative 0.07 to 0.07 in increments of 0.07; negative 0.06 to 0.06 in increments of 0.06; negative 0.2 to 0.2 in increments of 0.2; negative 0.2 to 0.2 in increments of 0.2; and negative 0.2 to 0.2 in increments of 0.2 (y-axis) across diphenyl phosphate; composite of dibutyl phosphate and di-isobutyl phosphate; low and high bis(2-chloroethyl) phosphate; low and high bis(butoxyethyl) phosphate; and low and high bis(1-chloro-2-propyl) phosphate (x-axis) for all, female, and male.

Associations of DPHP, DBUP/DIBP, BCETP, BBOEP, and BCPP with preterm (n=449) and early-term (n=1,436), compared with full-term birth (n=3,947), gestational age (in weeks) (n=6,646), and BW-GA z-score (n=6,646) among all newborns in the ECHO cohorts, and stratified by child’s sex (females: n=3,250, males: n=3,396). Point estimates indicate regression coefficients or odds ratios (ORs), and error bars indicate 95% confidence intervals (CIs). Regression models were adjusted for maternal race/ethnicity, maternal age at delivery, maternal education, maternal marital status, maternal prepregnancy BMI, maternal smoking during pregnancy, parity, child’s sex, and sample collection season and year. Sample size of each birth outcome by child’s sex is presented in Table 2, and numeric data regarding regression coefficients, ORs, 95% CIs, and p-values for main effects and interaction terms between child’s sex and OPE biomarkers are presented in Tables 4, 5, S7, and S8. Note: BBOEP, bis(butoxyethyl) phosphate; BCETP, bis(2-chloroethyl) phosphate; BCPP, bis(1-chloro-2-propyl) phosphate; BMI, body mass index; BW-GA, birth weight for gestational age; DBUP/DIBP, composite of dibutyl phosphate and di-isobutyl phosphate; DPHP, diphenyl phosphate; ECHO, Environmental influences on Child Health Outcomes.